AI Search Metrics: What to Track, What to Ignore, and What Benchmarks Look Like

By Dhriti Goyal
In the last twelve months, the typical CMO dashboard has filled up with new “AI search” tiles. Most of them measure nothing useful. AI impressions, AI mentions, AI overlap rate, brand-prompted recall scores, AI sentiment indexes – every category-creating vendor has shipped a metric in 2026, and most of them flatter the team without changing the pipeline.
The problem is not a shortage of measurement. It is a shortage of measurement that maps to revenue. When a metric goes up and the business does not move, the metric is not a leading indicator. It is vanity.
This piece is a working measurement guide for marketing leaders trying to separate the two. It explains the V/C/R stack – Visibility, Citation, Referral – that Pepper Atlas tracks across 4,200 enterprise URLs and forty verticals; the four metrics CMOs should ignore in 2026; the five they should put on the wall; and the benchmark ranges every vertical should compare itself against.
“What is measured improves; what is measured wrong erodes trust in the function. AI search has rewritten what is worth measuring.” -Anirudh Singla, Co-founder & CEO, Pepper Content (Index’25 keynote)
Why the Old Marketing Metrics Do Not Survive AI Search
Traditional SEO measurement was built around three assumptions: the SERP shows ten blue links, users click, and clicks drive sessions and pipeline. AI search invalidates all three.
In April 2026, AI Overviews appear on 48% of Google queries. Perplexity processes 1.5 billion searches a month. AI Mode sessions run roughly three times longer than classical search and the zero-click rate is 93%. The user gets the answer, then leaves the conversation. The click is no longer where commerce begins.
When clicks decouple from value, sessions decouple from pipeline, and rankings decouple from visibility – the entire pre-2024 metric stack misreports the truth. Top-ranked pages now lose 34.5% of their CTR when an AI Overview appears above them. But pages cited inside the AI Overview see CTR rise by up to 35%. Same SERP. Opposite outcomes. Only one of those signals is in your dashboard.
That is the gap the V/C/R stack closes.
The V/C/R Metric Stack: A Definition
The V/C/R framework – Visibility, Citation, Referral – is the measurement spine Pepper Atlas uses to score AI-search performance. Each layer answers a different question and guards against a different failure mode.
Visibility (V) – Are you in the room? Visibility measures how often your brand appears anywhere inside an AI surface across a fixed prompt set. It includes named mentions, source-list inclusions, image-grid appearances, and Knowledge Graph attachments. Visibility tells you whether the AI engines have indexed and considered you for the query universe that matters to your business.
Citation (C) – Did the AI quote you? Citation is the binary that matters. A brand is cited when it is named in the answer body, has a domain in the source list, or owns a hyperlinked URL inside the answer. Visibility is necessary but not sufficient; citation is what AI engines actually weight when users make decisions. Inside Citation sits Share of Answer – the percentage of category prompts on which you are cited – and Citation Frequency – how often each cited URL appears across the prompt set.
Referral (R) – Did the citation move the business? Referral measures qualified traffic, sessions, and pipeline impact attributable to AI surfaces. It includes LLM referral sessions, AI-attributed pipeline, and conversion rates against AI-referred users. Visibility without citation is noise; citation without referral is brand equity; the three layers together are revenue.
A complete dashboard tracks every layer. Most CMO dashboards in 2026 track only V, and they track the wrong V.
The Four Metrics CMOs Should Ignore in 2026
Some metrics look sophisticated and tell you nothing. These are the four that show up most often in vendor decks and should not show up on your wall.
1. AI Impressions Without Citation Context. “Your brand was mentioned 14,000 times across AI surfaces last month” is the modern equivalent of “your banner ad got 4 million impressions.” If those mentions are not cited, sourced, or attributed in the answer body, they do not influence buyer behaviour. They are noise rendered as a number.
2. Brand-Prompted Recall Scores. The methodology is to type “what is the best [category]?” and count whether your brand appears. The flaw is that real buyers do not run those prompts. Brand-prompted recall measures whether the AI knows your brand exists. It does not measure whether the AI cites you when an actual buyer is in the answer flow.
3. AI Sentiment Indexes. Vendor-supplied sentiment scores aggregate model outputs across hundreds of prompts and condense them into a 0–100 score. The score moves week-to-week with no underlying behaviour change. It is a feeling about a vibe, scaled. If a metric cannot be tied to a content change or a citation gain, it is not a metric – it is a slide.
4. Total LLM Crawl Hits. A high crawl count is often confused with high inclusion. It is not. Crawl hits measure how often LLM agents fetched a URL. Inclusion measures whether the URL was used. Pages with thousands of crawl hits and zero citations are common – the AI fetched them, evaluated them, and did not quote them. Reporting crawl hits as a success metric is reporting noise as signal.
The shared pattern is this: each of these metrics moves without the business moving, and the business moves without any of them noticing. They are decoupled from outcomes by design.
The Five Metrics CMOs Should Put on the Wall
These are the five Pepper Atlas surfaces as P1 in every CMO dashboard. They map cleanly onto V/C/R and they are the ones that move when content moves.
1. Share of Answer (Citation layer). The percentage of category prompts on which your brand is cited. The cleanest leading indicator of pipeline in our reference dataset. Bi-weekly cadence. Locked prompt set. Trend lines stay clean and gains are unambiguous.
2. Citation Frequency (Citation layer). Of the prompts where you appear, how many citations do you receive on average? A brand cited once across 100 prompts has a different position than a brand cited four times across forty. This metric isolates depth from spread.
3. LLM Referral Sessions (Referral layer). Real, attributable traffic from AI surfaces, segmented by source – Perplexity, ChatGPT, Gemini, and Google AI Overviews/Mode. PlushBeds drove a 753% surge in this metric inside five months. It is the cleanest revenue-correlated number in the stack.
4. AI-Referred Conversion Rate (Referral layer). The conversion rate of AI-referred sessions versus the organic baseline. In the Atlas reference dataset, AI-referred users convert at 2.1× the baseline rate on B2B free-trial flows. If yours is below 1.4×, you have a landing-page mismatch – the AI sent qualified buyers and the page failed to convert them.
5. Cited Asset Concentration (Visibility layer). What percentage of your citations come from your top ten URLs? Healthy is 35-55%. Above 70% means you are over-reliant on a small surface area; below 25% means your brand presence is too diluted to defend a category.
These five, tracked together, give a CMO the signal she needs without the noise vendors prefer to sell.
Cross-Industry Benchmark Ranges (Atlas Q1’26)
The benchmark question every CMO asks is: what does good look like for our vertical? The Atlas Q1’26 dataset gives the cleanest public answer – pulled from 4,200 enterprise URLs, 14,000 prompts, and forty verticals. Ranges are reported as median → leader. The LLM Referral Index normalises traffic against a vertical median set to 100.
| Industry | Share of Answer (median → leader) | Citation Frequency / 100 prompts (median → leader) | LLM Referral Index (median → leader) | Quick read |
| SaaS & B2B Tech | 4.1% → 22.0% | 6 → 38 | 100 → 540 | Schema and data depth widen the leader gap. |
| Financial Services | 2.8% → 17.4% | 3 → 24 | 100 → 380 | YMYL E-E-A-T enforcement decides citations. |
| Healthcare & Life Sciences | 2.2% → 14.1% | 2 → 19 | 100 → 310 | Peer-reviewed sources dominate citations. |
| Retail & Consumer Goods | 5.6% → 26.8% | 9 → 46 | 100 → 620 | Most volatile vertical; cycle-driven swings. |
| Education & EdTech | 6.0% → 28.3% | 10 → 51 | 100 → 700 | AI Overviews trigger on 83% of queries. |
| Travel & Hospitality | 3.4% → 19.2% | 5 → 31 | 100 → 460 | Multimodal pages clear 2-3 points higher. |
| Industrial & Manufacturing | 1.9% → 11.7% | 2 → 16 | 100 → 270 | Lowest median, highest upside per quarter. |
The shape of the data is consistent across every vertical. Median brands sit at single-digit Share of Answer and a Referral Index near 100; leaders sit at three-to-six times those numbers. The middle is empty. Either you have invested in citation infrastructure or you have not – and the metric reveals which side you are on within four weeks of measurement.
“Enterprise marketing is being re-architected around retrievability, not production volume.” – Mandy Dhaliwal, CMO, Nutanix (Index’25)
The benchmark numbers are the receipt for that re-architecture.
How to Build the Five-Tier CMO Dashboard
A working measurement program does not require a six-figure tool stack. It requires five tiles, in this order, refreshed every two weeks.
Tile 1 – Share of Answer (locked prompt set). Run the same 100–500 prompts across ChatGPT, Perplexity, Gemini, AI Overviews, and AI Mode. Count citations. Divide. The bi-weekly trend line is the single most predictive number you have.
Tile 2 – Citation Frequency by Top-25 URLs. For your top twenty-five priority URLs, count cited prompts per page. Sort descending. The top decile is your asset spine – reinforce it. The bottom decile is your rebuild list.
Tile 3 – LLM Referral Sessions, segmented by source. Tag inbound sessions by referer (Perplexity, ChatGPT, Gemini, Google) using server-log parsing or your analytics tool’s UTM rules. Look at week-over-week and surface-by-surface trends. If Perplexity is flat but Gemini is climbing, you are gaining different optimisation surfaces and need to investigate why.
Tile 4 – AI-Referred Conversion Rate. Compare conversion rates for AI-referred sessions against your organic baseline. If the ratio drops below 1.0×, you have a landing-page or messaging mismatch – fix the destination, not the source.
Tile 5 – Cited Asset Concentration. Calculate the share of total citations contributed by your top ten URLs. Track it monthly. Below 25% means dilution; above 70% means fragility.
Five tiles, two-week cadence, one quarterly review. That is the dashboard that has replaced the 27-tile MarTech Frankenstein in every Pepper enterprise customer’s QBR.
Insights: What Marketing Leaders Are Saying About AI-Search Measurement
The marketing leaders at Index’25 were unusually candid about how their teams are rewiring measurement. A few lines have stayed with me.
“The moment we stopped measuring brand programs by impressions and started measuring them by citation, we found the cheapest pipeline driver we had ever had. The AI cites you because the buyer would, and the buyer buys.” – Sydney Sloan, former CMO, G2 (Index’25)
“The moment we stopped measuring LinkedIn by follower growth and started measuring it by named citations in AI answers, the whole programme got easier. Fewer posts. Denser articles. Happier executives.” – Linda Caplinger, Head of SEO & AI Search, NVIDIA (Index’25)
“In a world where AI summarizes everything, the brands that get summarized favourably are the ones with the clearest positioning. Citation is the receipt for positioning quality.” – Angelique Bellmer Krembs, former CMO, PepsiCo (Index’25)
“AI search collapses the distance between brand and demand. On the dashboard, that means the awareness number and the demand number have collapsed into the same line – and that line is citation.” – Joyce Hwang, Head of Marketing, Dropbox (Index’25)
“Be the source worth citing. Publish facts, stats, and expert insights that tools like ChatGPT and Perplexity can’t ignore.” – Neil Patel (Index’25 keynote)
“GEO is not just a buzzword, but a new rule book for brand discovery, trust, and selection in an AI-first marketplace.” – Kishan Panpalia, Pepper Content (Index’25)
Measurement is how you keep score in that rule book.
The Quiet Truth About AI-Search Measurement
Most CMO dashboards in 2026 are still reporting last decade’s metrics with new labels. AI impressions, sentiment scores, recall indexes – they look modern and measure nothing the buyer does. The CMOs who are winning have already done the harder work: defined a prompt set, locked it, measured Share of Answer, isolated Citation Frequency, segmented LLM Referral by source, and tied AI-Referred Conversion to revenue.
The discipline is unglamorous. The dashboard is small. The result is the cleanest line between marketing investment and pipeline that the function has had in a decade.
Pick five tiles. Track them every two weeks. Cancel the rest.
Frequently Asked Questions
What is the V/C/R stack? Visibility (presence in AI surfaces), Citation (named or sourced inclusion in answers), and Referral (qualified traffic and pipeline). Each layer protects against a different failure mode.
Which AI metric is the cleanest leading indicator? Share of Answer. It moves six to nine weeks ahead of pipeline in the B2B Atlas dataset.
Why ignore AI impressions? Impressions without citation do not influence buyer decisions. They count noise.
What is a healthy Cited Asset Concentration? 35-55%. Below 25% means dilution, above 70% means fragility.
How often should the dashboard refresh? Every two weeks across a locked prompt set; quarterly playbook review.
Latest Blogs
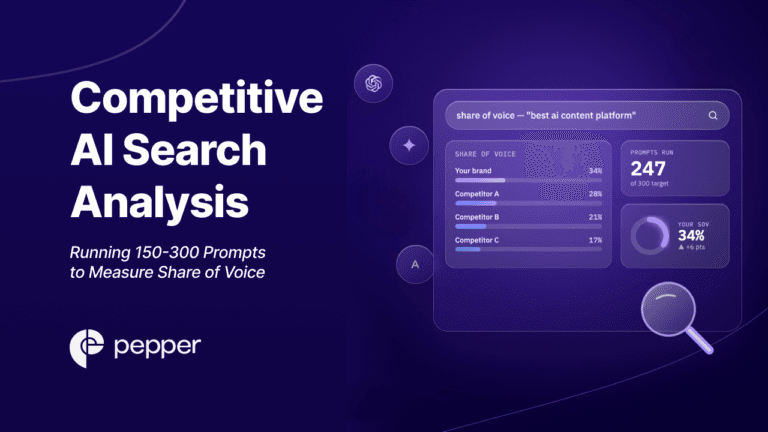
To measure your competitive position in AI search, you don’t track keyword rankings – you measure Share of Voice across a prompt universe. The methodology: build a representative set of 150–300 prompts covering your category’s real buyer questions, run them across every major LLM, and score how often each brand appears versus all brands mentioned. […]
When someone asks ChatGPT or Google’s AI about your brand, does it give you a thumbs up or a thumbs down? That’s what Answer Sentiment tells you. What is Answer Sentiment? (The Simple Version) Think of AI engines like really smart parrots. When people ask these parrots about your brand, they squawk out an answer. […]
You know how some stores have different entrances for customers and delivery trucks? AI-bot cloaking risk is kind of like deciding which door to open for the robot visitors that want to read your website. What is AI-Bot Cloaking Risk? (The Simple Version) Think of your website like your toy box. Some visitors are real […]
Get your hands on the latest news!

Similar Posts
Artificial Intelligence
12 mins read
Competitive AI Search Analysis: Running 150-300 Prompts to Measure Share of Voice
Artificial Intelligence
3 mins read
Answer Sentiment: Is AI Saying Nice Things About You?
Artificial Intelligence
4 mins read