What is the Share of Answer? Definition, Benchmarks, and How to Improve It

For two decades, marketers measured visibility in keyword rankings, organic sessions, and Share of Voice. None of those metrics survive contact with AI search. When a Gemini, Perplexity, ChatGPT, or AI Overview answer fills the screen before a user scrolls, position one is no longer a position. The rank is the answer. And the only question that matters is whether your brand is inside it.
That is what Share of Answer measures.
At Pepper, we have spent the last eighteen months tracking how AI engines source, weight, and cite content across more than 4,200 enterprise URLs and forty industry verticals. The pattern is so consistent that we have built our entire measurement layer – Atlas – around a single number: the percentage of category-defining prompts in which your brand appears inside the AI answer. We call that number Share of Answer, and it is the primary AI-search KPI for 2026.
“Search is undergoing the most profound transformation of our time. Generative AI is redefining how people discover, trust, and engage with information – moving us from keywords and rankings to intelligence and context at scale.” – Anirudh Singla, Co-founder & CEO, Pepper (Index’25 keynote)
This piece defines Share of Answer precisely, walks through how to calculate it, publishes Pepper Atlas’s first cross-industry benchmark set, and lays out the six-step improvement framework we ship with every enterprise engagement.
What Share of Answer Actually Means (and What It Replaces)
Share of Answer is the percentage of a defined set of category prompts on which a brand is cited, named, quoted, or linked inside an AI-generated answer across ChatGPT, Google AI Overviews, Google AI Mode, Perplexity, and Gemini. It is the AI-search successor to Share of Voice. Where Share of Voice asked “of all the noise in our category, how much is ours?”, Share of Answer asks the only question that now matters: “of all the answers in our category, how many feature us?”
Three properties make it different from anything in the old measurement stack.
First, the denominator is bounded. Share of Voice grew or shrank with media inflation. Share of Answer is calculated over a fixed prompt set you control – your category’s evaluative, comparative, and decision-stage queries – which means trend lines stay clean and gains are unambiguous.
Second, the unit of inclusion is a citation, not an impression. An AI answer either names you or it does not. There is no “almost,” no “above the fold,” no “weighted reach.” It is the cleanest binary metric marketing has had since open rates.
Third, it is leading, not lagging. Share of Answer movement precedes pipeline movement by roughly six to nine weeks in the B2B data we have audited. Brands that grow Share of Answer in Q1 see commercial-session lifts in Q2.
This last point is why CMOs are reorganizing measurement around it. Sydney Sloan, former CMO of G2, said it cleanly at Index’25:
“AI search has collapsed the distance between brand and demand. The metric we used to call ‘awareness’ is now the same metric that closes the deal. If the AI cites you in the answer, you are simultaneously on the consideration list and inside the purchase flow.” – Sydney Sloan, former CMO, G2 (Index’25)
How to Calculate Share of Answer
The formula is intentionally simple. The discipline lives in the inputs.
Share of Answer = (Number of category prompts in which the brand is cited ÷ Total number of category prompts measured) × 100
There are four inputs to define before the math.
1. The prompt set. A defensible Share of Answer measurement uses 100 to 500 prompts that span three intent layers: definitional (“what is X”), comparative (“X vs Y”), and decision-stage (“best X for Y”). The set should be locked for a quarter so movement reflects content gains, not measurement drift.
2. The platform mix. A complete measurement covers ChatGPT, Google AI Overviews, Google AI Mode, Perplexity, and Gemini. Most teams start with the two or three platforms their buyers use most, then expand. Pepper Atlas measures all five by default.
3. The citation rule. A “citation” must be defined in advance. The Pepper Atlas standard counts a citation when (a) the brand is named in the answer body, (b) the brand domain is in the source list, or (c) a brand-owned URL is hyperlinked. Looser rules inflate the metric; stricter rules under-report it.
4. The cadence. Weekly is too noisy; quarterly is too slow. Bi-weekly is the rhythm that surfaces changes inside a single content sprint without drowning teams in variance.
Run the numerator over the denominator across the platform mix, weight equally unless there is a strategic reason not to, and you have a Share of Answer figure that is comparable across quarters and across competitors.
Cross-Industry Share of Answer Benchmarks (Atlas Q1’26 Dataset)
The benchmark question every CMO asks first is, “what does good look like?” Until 2026, there was no public answer. Pepper Atlas’s Q1’26 dataset – pulled from 4,200 enterprise URLs, 14,000 prompts, and forty verticals – is the first cross-industry baseline.
| Industry | Median | Top Quartile | Leaders | What it tells you |
| SaaS & B2B Tech | 4.1% | 12.3% | 22.0% | Crowded category; leaders pull away on schema and data depth. |
| Financial Services | 2.8% | 9.6% | 17.4% | Widest gap median-to-leader; YMYL E-E-A-T enforcement is decisive. |
| Healthcare & Life Sciences | 2.2% | 7.9% | 14.1% | Strictest citation rules; peer-reviewed sources dominate. |
| Retail & Consumer Goods | 5.6% | 14.2% | 26.8% | Most volatile vertical; can move 4-6 points per product cycle. |
| Education & EdTech | 6.0% | 16.5% | 28.3% | AI Overviews trigger on 83% of queries – highest in the dataset. |
| Travel & Hospitality | 3.4% | 11.0% | 19.2% | Multimodal pages clear 2–3 points higher than text-only competitors. |
| Industrial & Manufacturing | 1.9% | 6.4% | 11.7% | Lowest median, highest upside – 8-10 point quarterly gains seen. |
SaaS & B2B Tech. Median Share of Answer is 4.1%. Top-quartile brands hit 12.3%. The category leaders – usually three or four brands per sub-segment – clear 22%.
→ Run your SaaS category in Atlas to see where you sit against the 22% leader line.
Financial Services. Median 2.8%, top-quartile 9.6%, leaders 17.4%. The vertical with the widest gap between median and leader, driven by E-E-A-T enforcement on YMYL queries.
→ See your finance benchmark in Atlas – the gap closes faster than most teams expect.
Healthcare & Life Sciences. Median 2.2%, top-quartile 7.9%, leaders 14.1%. Citation rules are strictest here; AI engines disproportionately cite peer-reviewed sources.
→ Atlas tracks healthcare-specific citation paths and peer-source weighting.
Retail & Consumer Goods. Median 5.6%, top-quartile 14.2%, leaders 26.8%. The most volatile category – Share of Answer can move 4-6 points in a single product cycle.
→ Track your retail Share of Answer in Atlas across launch windows.
Education & EdTech. Median 6.0%, top-quartile 16.5%, leaders 28.3%. AI Overviews trigger on 83% of education queries, the highest in our dataset, so Share of Answer is more important here than in any other vertical.
→ Atlas surfaces education-vertical insights, including dominant question types.
Travel & Hospitality. Median 3.4%, top-quartile 11.0%, leaders 19.2%. Heavily multimodal – properties with original photography and video clear two-to-three points higher than text-only competitors.
→ See multimodal lifts inside Atlas’s travel cohort.
Industrial & Manufacturing. Median 1.9%, top-quartile 6.4%, leaders 11.7%. The lowest median in the dataset and, paradoxically, the highest upside – under-served categories where one well-structured cluster can lift Share of Answer by 8-10 points in a quarter.
→ Audit your industrial category in Atlas before competitors close the gap.
The numbers above are revealing in themselves. The median brand in every vertical is below 7% Share of Answer. The leaders, in every vertical, are at four to six times the median. This is not a small gap that closes with effort. It is a structural advantage – visible only in measurement – that is compounding faster than any traditional SEO gap ever did.
The Six-Step Framework to Improve Share of Answer
Across Pepper’s enterprise engagements, the brands that move Share of Answer fastest run the same six-step framework. None of the steps are optional.
Step 1: Lock the prompt set. Before any content work, define the 100–500 category prompts you will measure. Without a fixed denominator, every gain is contestable. Atlas auto-generates a starter prompt set per vertical, but the editorial team must approve it.
Step 2: Audit citation paths. For each cited brand in your prompt set, identify which URL was cited and why. The patterns repeat: 50–70 word answer blocks, FAQPage and HowTo schema, named expert authors, and original first-party data.
Step 3: Rebuild the top fifty pages. Apply the structural rules – answer-forward openers, semantic HTML, schema density, multimodal density, multi-turn coherence – to your fifty highest-priority pages first. Mandy Dhaliwal, CMO of Nutanix, framed this at Index’25:
“Enterprise marketing is being re-architected around retrievability, not production volume.” – Mandy Dhaliwal, CMO, Nutanix (Index’25)
Fewer, deeper pages outperform high-volume content factories on every Atlas metric we track.
Step 4: Activate the author layer (the Creator schema move). Share of Answer is gated by author credibility. Implement Person schema for every byline, Organization schema for the brand entity, and – critically – a Creator schema layer linking each author to verified credentials, LinkedIn, and Knowledge Graph entities. This is the schema move that anchors Pepper’s IP claim on the metric: AI engines cite Creators, not anonymous content. Pages with full Creator schema show a 19.72% AI-Overview visibility lift in Atlas’s reference dataset.
Linda Caplinger, Head of SEO and AI Search at NVIDIA, made the same point at Index’25 from the publisher side:
“AI discovery rewards content that proves it has been lived. First-hand experience, original photography, real deployment data and a verified human attached to all of it.” – Linda Caplinger, Head of SEO & AI Search, NVIDIA (Index’25)
Step 5: Publish original data. The single highest-leverage content asset for Share of Answer is a number no other URL has. Surveys, internal benchmarks, lab-test results, original research. Content with proprietary statistics is cited 3.2x more often than commentary on someone else’s data.
Step 6: Measure bi-weekly, iterate quarterly. Pull Share of Answer every two weeks across the locked prompt set. Iterate the playbook quarterly based on which page rebuilds delivered the most citation lift. Compounding shows up between months three and six.
Insights: What Marketing Leaders Are Saying About Share of Answer
The marketing leaders at Index’25 were unusually candid about the metric shift. A few lines have stayed with me.
Angelique Bellmer Krembs, former CMO of PepsiCo, framed the deeper logic: in a world where AI summarizes everything, the brands that get summarized favourably are the ones with the clearest positioning and the most distinctive voice. Share of Answer is the first metric that puts a number on positioning quality. Generic content cannot be summarized distinctly. Commoditized messaging is invisible inside AI answers, and that invisibility is what Share of Answer makes legible.
“In a world where AI summarizes everything, the brands that get summarized favourably are the ones with the clearest positioning and the most distinctive voice.” – Angelique Bellmer Krembs, former CMO, PepsiCo (Index’25)
Joyce Hwang, Head of Marketing at Dropbox, flagged the operational trap most teams fall into: teams confuse Share of Answer with traffic. They are not the same. You can lose traffic and gain Share of Answer in the same quarter and that is usually the leading indicator of a stronger pipeline three months out. The companies tracking only sessions are flying with the wrong instrument.
“The moment we stopped measuring LinkedIn by follower growth and started measuring it by named citations in AI answers, the whole programme got easier. Fewer posts. Denser articles. Happier executives.” – Linda Caplinger, Head of SEO & AI Search, NVIDIA (Index’25)
Neil Patel, Index’25 keynote, gave the thesis line for the metric:
“Be the source worth citing. Publish facts, stats, and expert insights that tools like ChatGPT and Perplexity can’t ignore.” – Neil Patel (Index’25 keynote)
And from inside Pepper, Kishan Panpalia put the cultural moment in one line:
“Once in a generation, technology doesn’t just improve – it changes the way we see the world. GEO is not just a buzzword, but a new rule book for brand discovery, trust, and selection in an AI-first marketplace.” – Kishan Panpalia, Pepper (Index’25)
Share of Answer is how you keep score in that rule book.
The Quiet Truth About Share of Answer
The companies leading Share of Answer in 2026 are not producing the most content. They are producing the most provable content. Every signal AI engines weight – author credibility, schema, original data, multimodal density, freshness – is a proxy for one underlying question: can we trust this source enough to put its words in our mouth?
That question cannot be gamed. It can only be earned. And the brands earning it now are building an asset that compounds for years: the quiet, durable credibility of being the source AI chooses first.
The first step is measuring it. The next is improving it. And the only thing harder than starting today is starting six months from now.
→ Run your first Share of Answer audit in Atlas – a 14-day diagnostic across your category prompt set.
Frequently Asked Questions
Is Share of Answer the same as Share of Voice? No. Share of Voice measures media presence; Share of Answer measures inclusion in AI answers across a fixed prompt set. The two can move in opposite directions in the same quarter.
What is a good Share of Answer? It depends on the vertical. In SaaS, top-quartile is 12.3%; in retail it is 14.2%; in industrial it is 6.4%. The Atlas Q1’26 benchmarks above are the cleanest public reference.
How often should Share of Answer be measured? Bi-weekly across a locked prompt set is the rhythm that surfaces real movement without inflating variance.
Which AI engines should Share of Answer cover? ChatGPT, Google AI Overviews, Google AI Mode, Perplexity, and Gemini. Atlas measures all five by default.
What is the single highest-leverage move to improve Share of Answer? Implement Creator schema across every author byline, then publish a proprietary statistic no other URL has. Those two moves, together, drive most of the Share of Answer lift in our reference dataset.
Latest Blogs
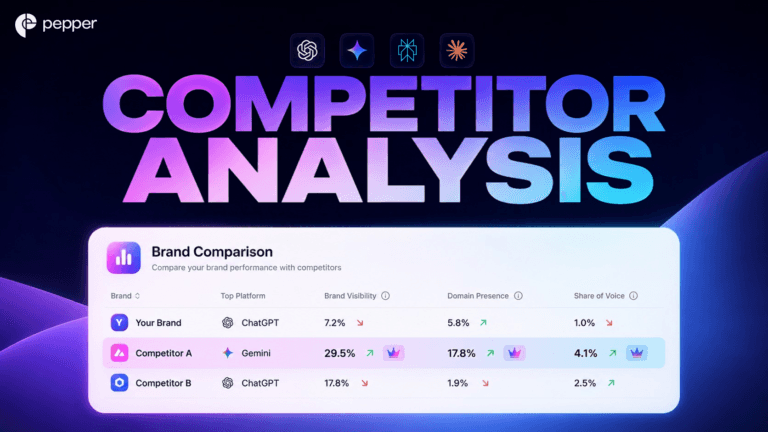
TL;DR If a competitor is beating you in AI search, staring at the gap accomplishes nothing. The only useful move is to focus on that one competitor and work out exactly how they win. Here is how you do it with Pepper’s GEO platform: start at the leaderboard, find the conversations they control, drill into […]
TL;DR A single AI visibility score tells you almost nothing about where you are winning or losing. The real story is a level down, in the individual questions buyers ask AI and the exact answers those engines give back. This is how Prompt Analysis in Pepper’s GEO platform works: every tracked question, whether AI named […]
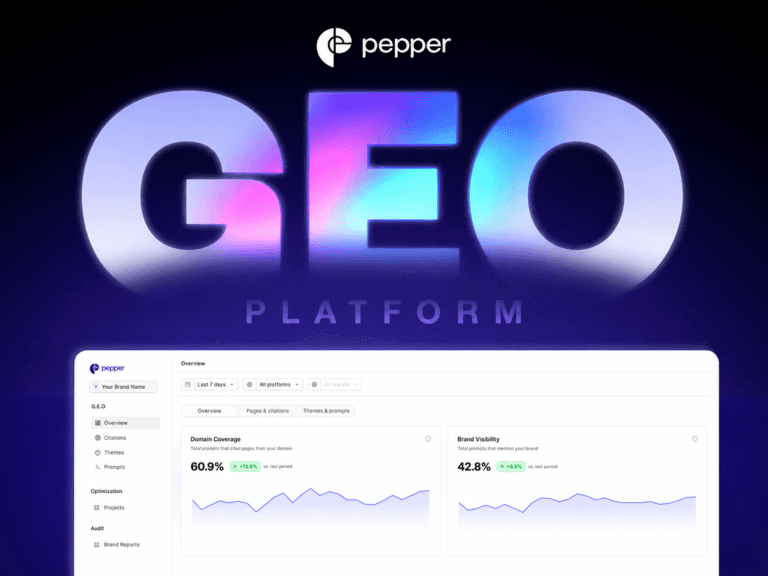
AI search does not work like Google. There is one answer, and your brand is either in it or it is not. Here is what actually decides whether AI names you, drawn from the instrument Pepper’s team has used to run GEO for enterprises, now launching as a platform.
Get your hands on the latest news!

Similar Posts
GEO / AI Search
5 mins read
Competitor Analysis: See Exactly How a Competitor Is Beating You

GEO / AI Search
5 mins read
Prompt Analysis: See the Exact AI Answers You’re Losing
GEO / AI Search
9 mins read