Competitive AI Search Analysis: Running 150-300 Prompts to Measure Share of Voice
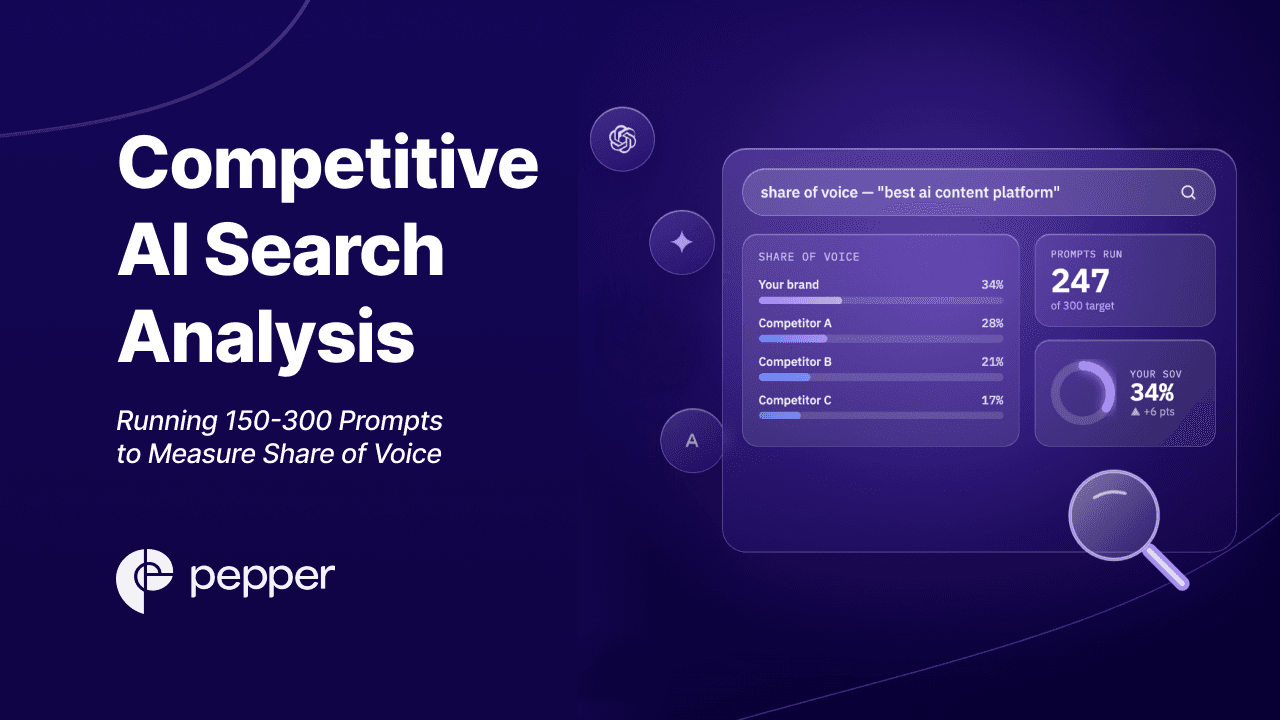
| To measure your competitive position in AI search, you don’t track keyword rankings – you measure Share of Voice across a prompt universe. The methodology: build a representative set of 150–300 prompts covering your category’s real buyer questions, run them across every major LLM, and score how often each brand appears versus all brands mentioned. The most important finding from running this analysis at scale: your AI search competitors are frequently not your business competitors. The brands stealing your share of answer often sell something completely different – they just structured their content better. |
How to Read the Competitive Map of AI Search
- Why Share of Voice Replaced Rankings as the Competitive Metric
- Step 1 – Build the Competitive Prompt Universe (150–300 Prompts)
- Step 2 – Run the Prompts Across Every Major LLM
- Step 3 – Score the Results: The Six Metrics That Matter
- Step 4 – Build the Brand Leaderboard and Theme Benchmarks
- The Critical Insight: AI Search Competition ≠ Business Competition
- From Analysis to Action
- Industry Updates: What Marketing Leaders Are Saying
- YouTube Script
- FAQ
Your real AI search competitor might be a company you’ve never heard of
When Pepper ran a competitive AI search analysis on its own category, the brand leaderboard held a surprise. The top competitors stealing share of voice in content-marketing queries weren’t just the obvious rivals. The list included Google, Semrush, OpenAI, Upwork, and Adobe – a search engine, an SEO tool, an AI lab, a freelancer marketplace, and a creative software company. Five ‘competitors,’ none of which sells what Pepper sells.
That’s the central truth of competitive AI search analysis: the brands winning your category’s answers are defined by content structure and citation authority, not by your competitive set. An LLM doesn’t know who your sales team считает a competitor. It knows which sources it trusts to answer a given question.
To see your real competitive position, you can’t look at keyword rankings. You have to measure Share of Voice across a representative prompt universe – typically 150 to 300 prompts run across every major LLM. This post is the complete methodology.
| “To be the number one cited, you have to be in this ecosystem. This is what is more important than it was six months ago, a year ago. It is changing so fast that this is what we are most focused on.” – Alexandra London, G2, at Pepper’s Index ’26 |
| DEFINITION: AI Search Share of Voice |
| AI Search Share of Voice is the percentage of your brand’s mentions across a defined prompt universe compared to all brand mentions returned for those prompts. It is the AI-era successor to traditional share of voice, measured not by ad impressions or keyword rankings but by how often a brand appears in generated answers across LLMs like ChatGPT, Gemini, Perplexity, and Claude. A brand with 25% Share of Voice appears in one of every four brand mentions the LLMs produce for its category’s questions. |
Why Share of Voice Replaced Rankings as the Competitive Metric
In traditional SEO, competitive analysis meant comparing keyword rankings – who ranks where for which terms. That framework breaks down in AI search, because there are no ranked results pages. There’s a single generated answer, and either your brand is in it or it isn’t.
The metrics shifted accordingly. The old competitive scorecard doesn’t map to the new reality:
| Old SEO Competitive Metric | New AI Search Competitive Metric |
| Keyword rankings | LLM citation mentions |
| Pageviews / impressions | AI answer appearances |
| Backlinks | Source-type index presence |
| Domain authority | Share of Voice across the prompt universe |
| Bounce rate | Retrieval depth (top-k % use) |
The reason Share of Voice became the headline metric: in AI search, your content can be seen by millions inside ChatGPT or Perplexity without the user ever leaving the AI interface. There’s no click to count. The only measurable competitive signal is whether – and how often – your brand is the answer.
Step 1 – Build the Competitive Prompt Universe (150–300 Prompts)
The prompt universe is the foundation of the entire analysis. It’s the representative set of questions your buyers actually ask LLMs across their journey. Get the universe right, and Share of Voice is meaningful. Get it wrong, and you’re measuring a category that doesn’t exist.
Why 150–300 prompts? Fewer than 150 produces unstable theme-level analysis – a single prompt swings the percentages too much. More than 300 adds collection cost without proportional insight at baseline. The 150–300 range, organized into 10–20 themes, gives statistically stable Share of Voice while remaining executable.
The Prompt Universe Construction Method
There are 4 sources to build a representative universe:
- Start with 10–20 themes that represent your category’s decision space (for a content platform: ‘AI-era SEO & GEO,’ ‘content production scaling,’ ‘content marketing ROI,’ ‘affordable solutions for startups’). Then write 10–20 prompts per theme. Theme-first construction ensures balanced coverage rather than clustering around the queries you already think about.Map themes first, then prompts –
- Every theme needs definitional prompts (‘what is X’), evaluative prompts (‘best X for Y’), and comparative prompts (‘X vs Y’, ‘alternatives to X’). Comparative prompts are where competitive Share of Voice is most directly contested.Cover all funnel stages –
- Pull the exact phrasing from sales calls, Reddit threads, Quora questions, and customer support tickets. ‘How do we scale content without hiring 20 writers’ is a real prompt; ‘content scaling solutions’ is a keyword. The LLM responds to the natural-language version.Use real buyer language –
- ‘Alternatives to [your brand]’ and ‘[competitor] vs [your brand]’ belong in the universe. These are the prompts where you’re most exposed, and the ones competitors are actively targeting. Omitting them produces a flattering but useless analysis.Include the questions you’d rather not ask –
| Pepper’s standard structure: 100 prompts across 10 themes for a focused audit, scaling to 150–300 prompts across 15–20 themes for a full competitive analysis. Each theme is balanced (equal prompt count) so no single theme distorts the aggregate Share of Voice. The prompt universe is then re-run monthly, with ~20 new prompts added as the category’s questions evolve. |
Step 2 – Run the Prompts Across Every Major LLM
A competitive analysis on one LLM is not a competitive analysis. Brand presence diverges sharply across platforms – a competitor can dominate Perplexity while being absent from ChatGPT, because each LLM draws from different retrieval sources and weights them differently.
The minimum platform set: ChatGPT, Google Gemini (including AI Overviews), Perplexity, and Claude. The aggregate combines all of them – Pepper’s theme benchmarks, for example, are a blend of ChatGPT, AI Overviews, Claude, and Perplexity results, because the goal is a category-wide competitive picture, not a single platform’s view.
There are 4 execution rules that protect the validity of the comparison:
- Clean sessions – no memory, no history, no custom instructions. You’re measuring the default competitive landscape a new buyer sees.
- Consistent collection window – run the full universe within 1–2 days, because answers drift and a scattered window corrupts comparability across brands.
- Capture every brand mentioned – not just yours. The denominator of Share of Voice is all brand mentions, so you must record every brand each answer names.
- Record position and sentiment – was your brand mentioned first or fifth? Positively or with a caveat? Position and sentiment are competitive signals, not just presence.
At 200 prompts across 5 platforms, that’s 1,000 executions per analysis cycle – before competitor extraction. This is the work that platforms like Pepper’s Atlas automate, with weekly re-scans and competitor-movement alerts.
Step 3 – Score the Results: The Six Metrics That Matter
Raw answer data becomes competitive intelligence through six metrics. Each measures a different dimension of competitive position:
| Metric | What It Measures | Competitive Read |
| Brand Mentions | Times your brand appears across all tracked prompts | Raw visibility footprint |
| Share of Voice | Your mentions ÷ all brand mentions | Your slice of the category’s answer space |
| Brand Position | Average position of your brand within answers | Whether you’re the first or fifth option named |
| Brand Coverage | % of prompts that mention your brand | Breadth across the category’s questions |
| Domain Citations | Times your website is cited as a source | Whether your owned content earns evidence status |
| Domain Coverage | % of prompts that cite your website | Breadth of your site as a cited source |
Share of Voice is the headline number, but the combination tells the strategic story. High Brand Mentions with poor Brand Position means you’re named but never first. High mentions with low Domain Citations means the market knows you but your own content isn’t the source – third parties are speaking for you. Each pattern implies a different competitive move.
Step 4 – Build the Brand Leaderboard and Theme Benchmarks
The brand leaderboard is the single most clarifying output of the analysis. It ranks every brand by Share of Voice across the full universe – and it almost always contains surprises.
Here’s an illustrative leaderboard from a content-marketing category analysis, showing Share of Voice and mention counts:
| Rank | Brand | Share of Voice |
| #1 | 25.1% (74 mentions) | |
| #2 | Semrush | 16.6% (49 mentions) |
| #3 | Contently | 15.6% (46 mentions) |
| #4 | HubSpot | 15.6% (46 mentions) |
| #5 | ClearVoice | 11.9% (35 mentions) |
| #6 | OpenAI | 11.9% (35 mentions) |
| #7 | Upwork | 11.9% (35 mentions) |
| #8 | Ahrefs | 10.8% (32 mentions) |
| #9 | Adobe | 10.2% (30 mentions) |
Beneath the leaderboard sits the theme benchmark – a matrix showing each competitor’s visibility percentage per theme. This is where strategy lives. In one real analysis, Google owned 63% of ‘SEO & Organic Growth on Limited Budget’ but only 10% of ‘Expert Content Talent & Production Scaling.’ HubSpot dominated ‘AI-Powered Marketing Transformation & ROI’ at 47% but was absent on others. No single brand owned everything – each had theme territories, and the gaps between territories are the openings.
| Reading the theme benchmark for opportunity: look for themes where no competitor exceeds ~20% Share of Voice. Those are fragmented themes with no entrenched leader – the fastest places to build your own Share of Voice. Themes with a 40%+ incumbent require a longer, entity-and-authority-driven campaign to contest. |
The Critical Insight: AI Search Competition ≠ Business Competition
This is the finding that reframes the entire exercise. The brands competing with you for AI search Share of Voice are frequently not the brands competing with you for customers.
In the content-marketing leaderboard above, a content platform’s top competitors for answer-space included Google (a search engine), OpenAI (an AI lab), Upwork (a freelancer marketplace), and Adobe (creative software). None of them is a head-to-head business competitor. They appear because LLMs assemble answers from whatever sources best match the question – and those companies had published content that matched.
There are 3 reasons AI search competition diverges from business competition:
- When a buyer asks ‘how do I scale content production,’ the LLM pulls from any source that answers it well – a freelancer marketplace’s guide, an AI lab’s blog, a search engine’s documentation. Category boundaries don’t constrain the answer.LLMs answer questions, not market categories –
- A company that isn’t your business rival but structured its content for citability will out-rank you in answers. The leaderboard rewards citability, not market share.Content structure beats market position –
- Large adjacent companies (Google, Adobe, HubSpot) have vast content libraries spanning many topics, giving them incidental Share of Voice in your category even without targeting it. They’re competing with you by accident – and winning.Adjacent players have content surface area –
The strategic implication is profound: your competitive content strategy must target the brands winning your answers, not the brands on your sales battlecards. Benchmarking only against your known business competitors will miss the players actually taking your share of voice – and they’re often the easier ones to displace, because they’re not defending your category on purpose.
From Analysis to Action
A competitive AI search analysis is only valuable if it changes what you do. The output should drive 4 specific actions:
- Themes where no competitor exceeds ~20% Share of Voice are your fastest wins. Build the comparison pages, definitional content, and FAQ guides that let you claim those answers before an incumbent forms.Target the fragmented themes first –
- For the themes you want to contest, trace why the leaders win. Is it G2 placement? YouTube? Comparison pages? Reddit threads? Each citation source is a replicable asset.Reverse-engineer the leaders’ citation sources –
- Add the brands actually winning your Share of Voice to your competitive tracking – even if they’re not business competitors. Build comparison and alternative content against the brands LLMs name, not just the ones sales worries about.Reframe your competitive set –
- Establish a baseline, set targets per theme, and re-run the full universe monthly to measure lift and catch competitor moves. Share of Voice is a tracked KPI, not a one-time snapshot.Set Share of Voice targets and re-run monthly –
Industry Updates: What Marketing Leaders Are Saying
‘Turn On Your Review Engine’ – The G2 Ecosystem Imperative
Alexandra London of G2 delivered one of the most actionable competitive insights at Pepper’s Index ’26: review platforms are now a primary determinant of AI search Share of Voice. ‘If you are not capturing reviews in real time and at scale, you will fall behind in LLMs,’ she told the room. G2 powers reviews directly into the LLMs and described itself as the number-one cited source across them. For competitive analysis, this means a competitor’s review velocity is a leading indicator of their future Share of Voice – and a tracked dimension of any serious analysis.
Buyers Now Start Their Search in AI, Then Validate
London’s data at Index ’26 showed a structural shift in buyer behavior: buyers now begin their evaluation inside an AI search function, then validate against review sites and vendor websites. The competitive implication: the brand that wins the initial AI answer shapes the entire consideration set before a buyer ever reaches a comparison page. Share of Voice in the opening answer is no longer a vanity metric – it’s the gate to the shortlist.
The Shift From Share of Voice to Share of Answer
Across Index ’26, leaders described the metric evolution from share of voice to ‘Share of Answer’ – a Pepper-coined framing for the percentage of AI answers in which a brand appears. The distinction matters competitively: share of voice historically measured ad and media presence; Share of Answer measures presence inside the generated response itself. Boards are beginning to ask for Share of Answer as a tracked metric, with one enterprise CMO describing measuring it ‘down to the pipeline and the revenue.’
Competitor Moves Now Happen in Days, Not Quarters
A recurring operational theme at Index ’26: AI search Share of Voice shifts far faster than traditional rankings. Sydney Sloane, an investor on the ecosystem panel, noted that a change a brand makes ‘will literally show up as a result that same week.’ For competitive analysis, this collapses the monitoring cadence – a quarterly competitive review misses moves that happen weekly. The brands maintaining competitive advantage run weekly Share of Voice scans, not quarterly audits.
The Closed-Loop Competitive Intelligence System
Dave, an investor on the Index ’26 ecosystem panel, described where competitive AI search analysis is heading: ‘Startups work with companies like Pepper to optimize appearance in answer engines, then take that signal, go back automatically, produce new content for all the channels, and then measure the impact.’ The competitive analysis is becoming a continuous loop – measure Share of Voice, identify gaps, produce content, re-measure – rather than a periodic report. The brands that automate this loop compound their competitive advantage faster than those running manual quarterly analyses.
FAQ: Competitive AI Search Analysis
What is AI search Share of Voice and how is it different from traditional share of voice?
AI search Share of Voice is the percentage of your brand’s mentions across a defined prompt universe compared to all brand mentions the LLMs return for those prompts. Traditional share of voice measured ad spend or media presence relative to competitors; AI search Share of Voice measures presence inside generated answers across ChatGPT, Gemini, Perplexity, and Claude. The shift matters because in AI search there are no ranked results to count – either your brand is in the answer or it isn’t, and Share of Voice quantifies how often it is.
How many prompts do I need for a competitive AI search analysis?
Between 150 and 300 prompts, organized into 10–20 balanced themes. Fewer than 150 produces unstable theme-level analysis because a single prompt swings the percentages too much; more than 300 adds collection cost without proportional insight at baseline. Each theme should have an equal prompt count so no single theme distorts the aggregate Share of Voice, and the universe should cover definitional, evaluative, and comparative prompts across the full buyer journey – including ‘alternatives to your brand’ and ‘competitor vs your brand’ queries.
Which LLMs should a competitive AI search analysis cover?
At minimum ChatGPT, Google Gemini (including AI Overviews), Perplexity, and Claude, with the aggregate blending all of them for a category-wide view. Single-platform analysis is unreliable because brand presence diverges sharply across LLMs – a competitor can dominate Perplexity while being absent from ChatGPT, since each platform draws from different retrieval sources. At 200 prompts across 5 platforms, that’s 1,000 executions per cycle, which is why competitive analysis at scale is typically automated through a platform rather than run manually.
Why are my AI search competitors different from my business competitors?
Because LLMs answer questions, not market categories. When a buyer asks how to solve a problem, the LLM pulls from any source that answers it well – which may be a company that doesn’t sell what you sell but structured its content for citability. Large adjacent players (search engines, AI labs, creative software companies) have vast content libraries that earn them incidental Share of Voice in your category. The practical consequence: your competitive content strategy must target the brands actually winning your answers, not just the rivals on your sales battlecards – and the accidental competitors are often easier to displace because they aren’t defending your category on purpose.
How often should I run a competitive AI search analysis?
Run the full prompt universe monthly, with weekly scans on priority themes and competitors. AI search Share of Voice shifts in days, not quarters – a change a competitor makes can show up in answers the same week. A quarterly competitive review misses moves that happen weekly, ceding advantage to faster-moving competitors. The recommended cadence is a monthly full re-run to measure lift and catch competitor moves, plus weekly priority scans, with roughly 20 new prompts added each month as the category’s questions evolve.
| Want your competitive AI search analysis run automatically? Pepper’s Atlas platform builds your prompt universe, runs it across ChatGPT, Gemini, Perplexity, and Claude, and delivers your Share of Voice, brand leaderboard, and theme benchmarks – with monthly re-runs and competitor-movement alerts built in. Start your competitive analysis at atlas.pepper.inc |
Latest Blogs
To measure your competitive position in AI search, you don’t track keyword rankings – you measure Share of Voice across a prompt universe. The methodology: build a representative set of 150–300 prompts covering your category’s real buyer questions, run them across every major LLM, and score how often each brand appears versus all brands mentioned. […]
When someone asks ChatGPT or Google’s AI about your brand, does it give you a thumbs up or a thumbs down? That’s what Answer Sentiment tells you. What is Answer Sentiment? (The Simple Version) Think of AI engines like really smart parrots. When people ask these parrots about your brand, they squawk out an answer. […]
You know how some stores have different entrances for customers and delivery trucks? AI-bot cloaking risk is kind of like deciding which door to open for the robot visitors that want to read your website. What is AI-Bot Cloaking Risk? (The Simple Version) Think of your website like your toy box. Some visitors are real […]
Get your hands on the latest news!

Similar Posts
Artificial Intelligence
3 mins read
Answer Sentiment: Is AI Saying Nice Things About You?
Artificial Intelligence
4 mins read
AI-Bot Cloaking Risk: Should You Hide Your Website from Robot Visitors?
Artificial Intelligence
3 mins read