AI search statistics that hold up in 2026, and the ones that do not
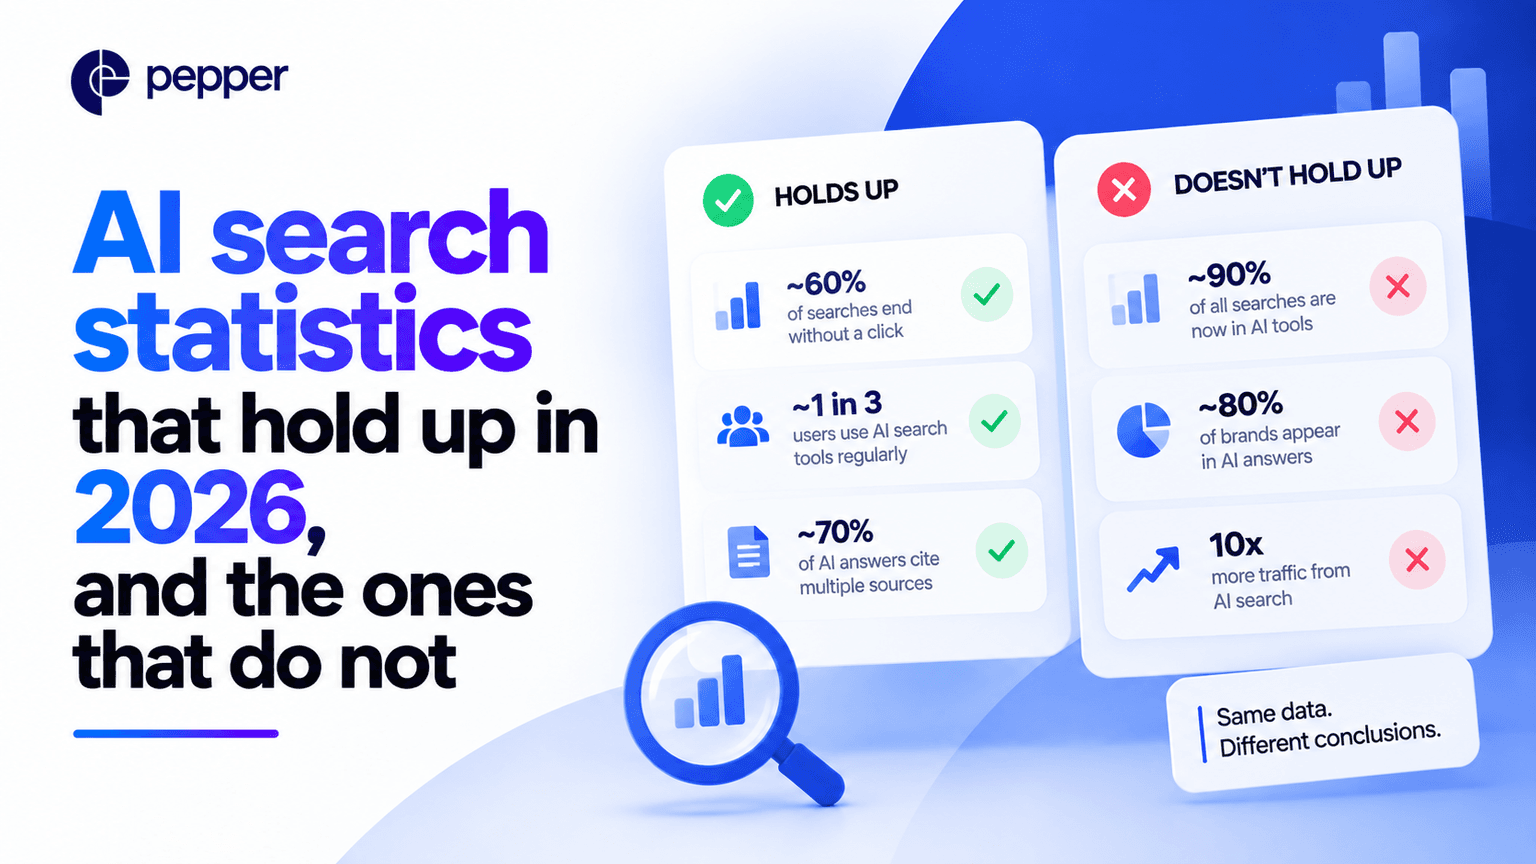
The short answer
Yes, AI search is growing, and the growth is measured rather than asserted. The share of US adults using ChatGPT went 18%, 23%, 34%, 44% across four annual Pew surveys. Half now use some AI chatbot. Four in ten use one to look things up.
The harder question, and the one Pepper gets asked in client reviews, is which AI search statistics you can put in front of a board without one collapsing when somebody opens the source. Most of the numbers circulating in this category fail at least one of four tests, and the page you are reading right now failed all four until today.
So this page does two things. It gives the numbers we would defend, each with its sample, method and date attached. And it names the widely repeated ones that no longer hold. That includes a Pew study we like, whose underlying data is from March 2025 and is still quoted as though it described this year.
Key takeaways
- ChatGPT use among US adults has roughly doubled in two years, from 23% in 2024 to 44% in 2026, on the same annual survey with the same method. That repetition is why the number is trustworthy.
- Earned media accounts for 84% of AI citations and paid content for 0.3%. Across three editions of the same study since July 2025, earned media has stayed between 82% and 89%.
- AI-referred retail traffic converts better than non-AI traffic, and has done for eleven consecutive months. The often-quoted 42% figure is real and out of date: it was 54% in May 2026 and 60% in July.
- The most-cited AI Overviews click statistic is eighteen months old. Pew found people clicked a result link on 8% of visits with an AI summary against 15% without. That is browsing data from March 2025, not from 2026.
- The lever has not changed, only the surface. Engines cite third-party sources far more than brand sites, which is the whole argument behind Pepper’s agentic organic growth engine.
A note on where this comes from. We run organic for more than 250 enterprises and track more than 10 million prompts across every major engine. The statistics below are other people’s, opened at source and dated. The judgement about which survive is ours, shaped by the board papers and business cases we are asked to sanity-check in client reviews most weeks.
Book a growth audit if you need your own number rather than the market’s.
What is an AI search statistic worth, and what makes one hold up?
A statistic is not true because it is repeated. It is usable when you can open the thing it came from and see how it was made, which is the test Pepper applies before any number goes into a client deck.
Four tests decide it, in the order we apply them. A named primary source you can open, because a figure attributed to a blog that attributes it to another blog has no origin. A stated method, meaning sample size, population and field dates. A date, and a period still worth quoting, because search surfaces changed more in eighteen months than in the previous eight years. And more than one measurement, because a single reading is a photograph while a series is evidence.
The weights we put on those four, and what would change them, are in the methodology section below.
Is AI search growing?
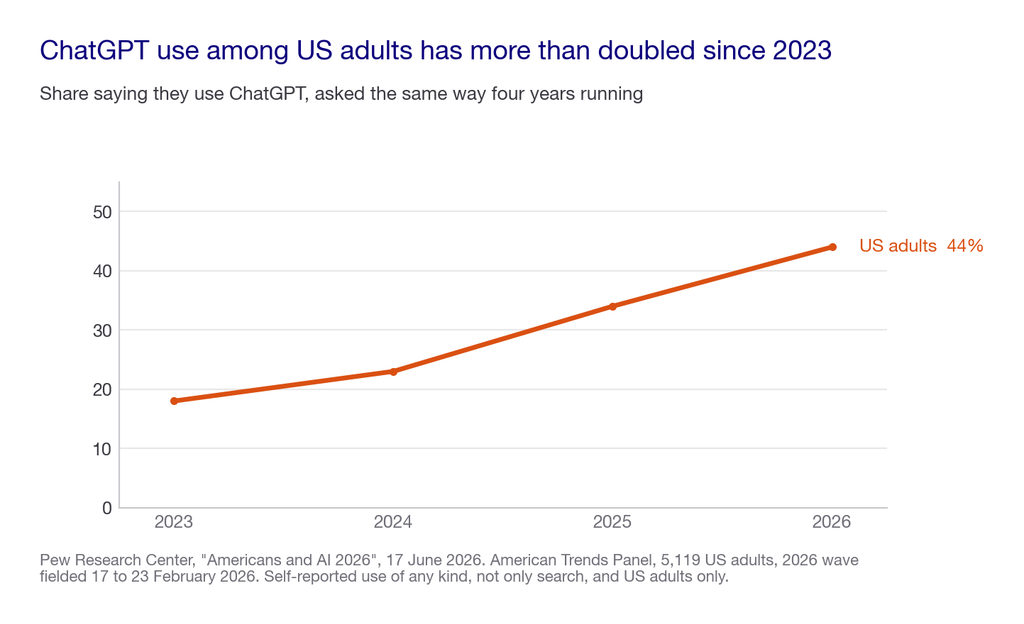
Yes, and this is the series we would put in front of a board, because Pew has now asked the same question four years running.
Share of US adults who say they use ChatGPT: 18% in 2023, 23% in 2024, 34% in 2025, 44% in 2026. Roughly a doubling in two years, and more than double the 2023 figure.
The rest of the same survey, fielded 17 to 23 February 2026 among 5,119 US adults on Pew’s American Trends Panel:
- 49% use some AI chatbot, against 33% in 2024.
- 42% say they use chatbots to search for information. This is the number that matters most for anyone budgeting organic, because it is the one that describes substitution rather than curiosity.
- 60% say they read AI-generated search summaries.
- About 24% use a chatbot daily, including 12% several times a day and 4% almost constantly.
- Gemini is second, used by about a quarter of adults.
- Adults under 50 are about twice as likely to use ChatGPT as those 50 and over, 57% against 28%.
Where this falls short, and it matters: this is US adults only. It is self-reported. And “use ChatGPT” covers everything from drafting an email to replacing a search. If your market is outside the US or business-to-business, this series tells you the direction and not your number.
Where AI answers actually come from
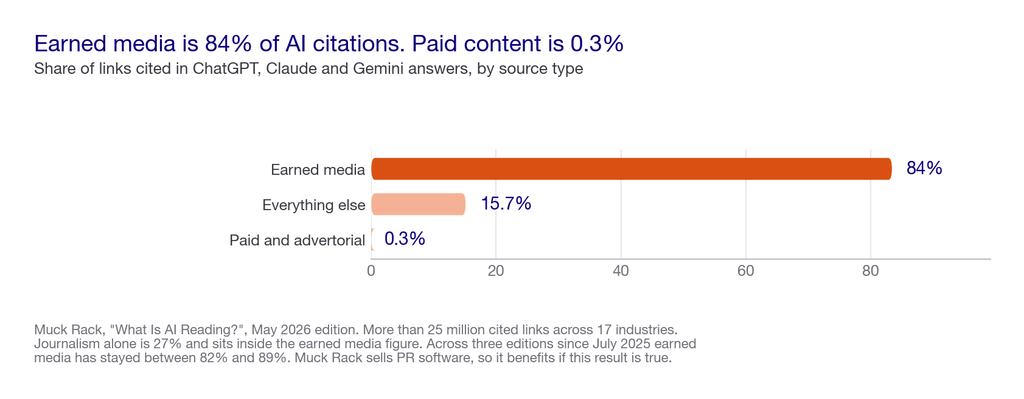
This is the statistic we quote most often. It decides what you do, where the others describe the weather.
Muck Rack’s “What Is AI Reading?” was published in May 2026. It analysed more than 25 million links cited in ChatGPT, Claude and Gemini responses, across 17 industries.
- Earned media accounts for 84% of all AI citations.
- Paid and advertorial content accounts for 0.3%.
- Journalism alone is 27% of cited sources.
- Press releases appear almost exclusively in industry-trend answers, at 3.5 times the rate they appear in best-of queries.
It passes the fourth test, which is rare. Across three editions going back to July 2025, earned media has ranged between 82% and 89%, and journalism has stayed between 25% and 27%. A number that has been measured three times by the same method and moved inside a seven-point band is a number you can plan against.
Where it falls short: Muck Rack sells media database and PR software, so it has a commercial interest in earned media mattering. The methodology is published and the sample is large, which is why we use it, but you should know who paid for it. The cut is also by source type rather than by industry, so your category may differ.
If the number surprises you, that is the point. It means the lever sits outside your own website. That is the argument in the Visibility, Citability and Retrievability framework, and the reason entity and citation work now outranks publishing volume.
What AI-referred traffic is worth when it arrives
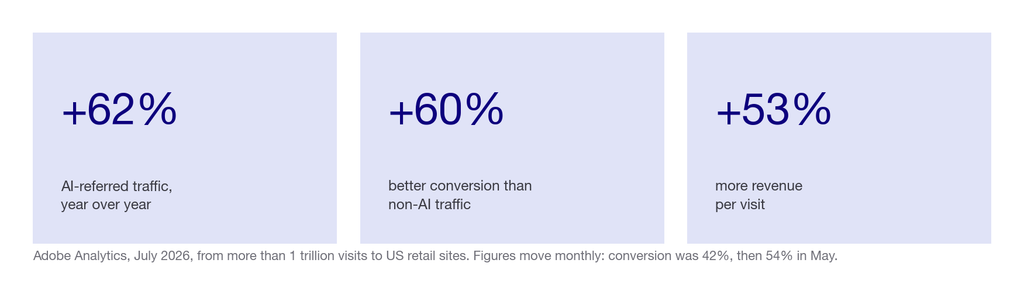
Adobe Analytics reports monthly on AI-referred traffic to US retail sites, drawing on more than 1 trillion visits. For July 2026:
- AI-referred traffic grew 62% year over year, and is up 1,219% since October 2024.
- It converted 60% better than non-AI traffic, the eleventh consecutive month AI traffic outperformed.
- Revenue per visit was 53% higher.
- Time on site was 59% higher, bounce rate 33% lower, cart additions 28% more frequent.
This is the clearest example on the page of a statistic that is true and perishable. The figure most often quoted in decks is 42% better conversion. That was accurate earlier in 2026. It was 54% in May and 60% in July. Quoting 42% in September is stale rather than wrong. The same applies to the 393% year-over-year traffic figure from Q1, which had fallen to 62% by July as the base grew.
Where this falls short: it is US retail only, so it says nothing directly about B2B, services or other markets. Attribution of a visit to an AI referrer is imperfect. And we could not open Adobe’s own pages on 22 September 2026. Both timed out, so we read the July figures in Digital Commerce 360’s report of 19 August 2026. Adobe is the origin, a trade publication is where we read it, and you should know the difference.
Our methodology: how we scored each statistic
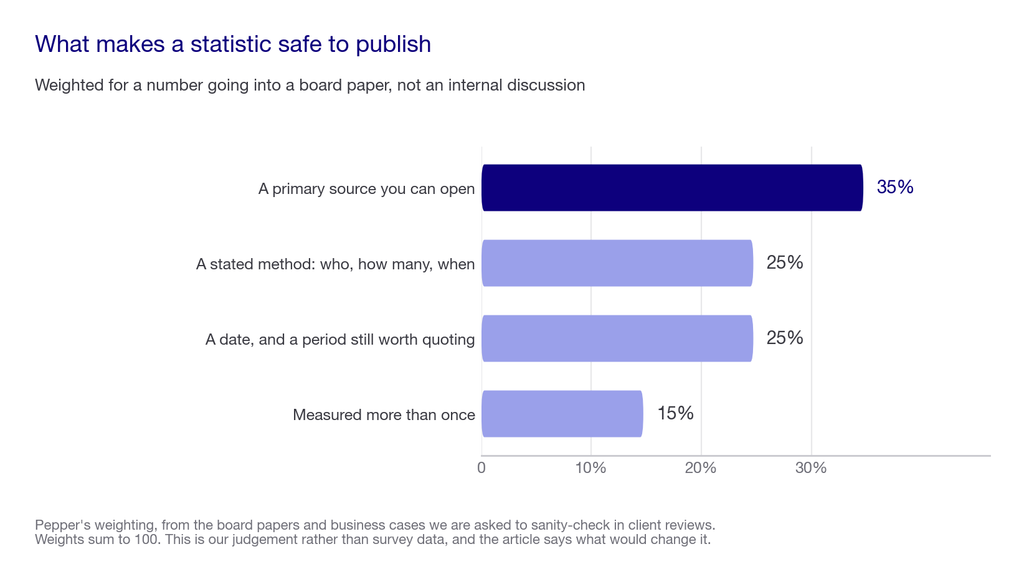
| Test | Weight | Why it carries that weight |
|---|---|---|
| A named primary source you can open | 35 | The single most common failure. A figure attributed to a blog that attributes it to another blog has no origin, and the chain usually ends at nothing. |
| A stated method: who, how many, when | 25 | Sample size, population and field dates. Without them you cannot tell whether the number describes your market or somebody else’s. |
| A date, and a period still worth quoting | 25 | Search surfaces changed more in eighteen months than in the previous eight years. A good study about 2025 is not a claim about 2026. |
| Measured more than once | 15 | A number measured repeatedly by the same method shows you whether it is stable or moving. One measurement is a photograph, a series is evidence. |
Weights sum to 100. The first two carry 60 between them, which is a judgement rather than a fact, and it is the judgement this page rests on. We publish our weightings the same way we publish [how we rank GEO agencies](https://www.pepper.inc/blog/geo-agency-ranking-methodology/), so you can argue with them precisely.
What would change these weights. If you are writing a strategy paper rather than a board paper, the repetition test matters more and the date test slightly less. A stable trend is worth more than a fresh point. If you are quoting a number publicly, the primary source test outranks everything.
The statistics that no longer hold up
Four numbers in wide circulation that we would not put in a board paper today, and why.
1. The AI Overviews click figures, from March 2025
Pew found that people clicked a traditional result link on 8% of visits to a Google results page carrying an AI summary. Without a summary it was 15% of visits. Inside the summary itself, 1%. The study covered 68,879 searches from 900 US adults on KnowledgePanel Digital.
The study is good and the citation is usually wrong. The browsing data was collected 1 to 31 March 2025 and published on 22 July 2025. Google AI Mode has launched since, AI Overviews coverage has expanded, and the surface people were clicking on no longer looks the same. It holds up as a finding about March 2025. It does not hold up as a claim about how search behaves now, which is how it is almost always used.
2. Google+ as a ranking factor
The version of this page we are replacing listed “Google+ is the highest correlated social factor for SEO ranking” as one of seven must-know facts. Google shut Google+ down for consumers on 2 April 2019. The page was published on 13 December 2021.
The original claim traces to correlation studies from around 2013 and 2014, and correlation was never causation even then. We have left this example in rather than deleting it quietly, because it is the clearest illustration of what happens when a fact is copied rather than checked.
3. “53% of all website traffic comes from organic search”
This appeared on the previous version of this page, attributed to a publication by name with no link and no date. The figure traces to industry channel-mix research from around 2019, and channel mix has moved since, in the direction this whole page is about.
The problem is not that it is false. It is that nobody quoting it can tell you the sample, the year or the population, which fails three of our four tests at once.
4. Any single number for “AI search market share”
We get asked for one most weeks. There is no reliable figure, because the surfaces are not comparable: an AI Overview appears inside a Google search, a ChatGPT answer replaces one, and a Perplexity answer sits somewhere between. Anyone offering you a single percentage for “AI’s share of search” is adding together things that are not the same unit.
AI search statistics at a glance
| Statistic | Figure | Source and date | Sample | Holds up? | Cost of quoting it wrong |
|---|---|---|---|---|---|
| US adults using ChatGPT | 44%, from 18% in 2023 | Pew Research Center, 17 Jun 2026 | 5,119 US adults, ATP, fielded 17 to 23 Feb 2026 | Yes, four annual measurements | Low. The direction is not in dispute |
| US adults using any AI chatbot | 49%, from 33% in 2024 | Pew Research Center, 17 Jun 2026 | As above | Yes | Low |
| US adults using chatbots to search | 42% | Pew Research Center, 17 Jun 2026 | As above | Yes, first measurement | Medium. One reading so far |
| US adults reading AI search summaries | 60% | Pew Research Center, 17 Jun 2026 | As above | Yes | Low |
| Earned media share of AI citations | 84%, paid 0.3% | Muck Rack, May 2026 | 25M+ links, ChatGPT, Claude, Gemini, 17 industries | Yes, stable 82 to 89% over three editions | Low, but disclose the publisher’s interest |
| AI-referred retail conversion advantage | 60% better than non-AI | Adobe Analytics, July 2026 | 1T+ visits, US retail | Yes, but monthly. Was 42%, then 54% | High. A stale figure underprices the channel by a third |
| AI-referred retail traffic growth | 62% year over year | Adobe Analytics, July 2026 | As above | Yes, but monthly. Was 393% in Q1 | High. The Q1 figure overstates it six times over |
| Clicks with an AI summary present | 8% against 15% without | Pew Research Center, 22 Jul 2025 | 68,879 searches, 900 US adults, March 2025 | Not as a 2026 claim | High. It describes a surface that has since changed |
| Google+ as top social ranking factor | n/a | Unsourced, on this page since 2021 | None | No. Google+ closed 2 Apr 2019 | Total. It ends the conversation |
| Organic share of all web traffic | 53% | Named publication, no link, no date | Unknown | No. Fails three of four tests | High. Nobody can tell you the year |
What this costs you to get wrong
A bad statistic is cheap to publish and expensive to defend.
- In a board paper, one collapsed number puts every other number in the deck under suspicion, including the ones that were right.
- In published content, engines increasingly cite sources that are themselves citable. A page with unsourced figures is a page that other people do not quote, which is the opposite of what the page was for.
- In a budget, a stale figure points money at the wrong surface. The 42% conversion number would have you value AI traffic a third lower than July’s data says it is worth.
- In a pitch, the person across the table opens the link. We have watched it happen.
The fix costs minutes. Open the source, note the sample and the date, and write both next to the number. If you cannot find an origin in two clicks, do not use the figure.
Where Pepper fits
We are an agentic organic growth engine. A statistics page sits on our blog because most of this work is measurement before it is anything else.
- An organic growth partner. A growth team is attached to your account, a senior strategist plus always-on agents, accountable for the number rather than for a list of deliverables.
- Pepper’s GEO platform. Genuinely self-serve and included rather than billed as a separate licence. You log in and set up a workspace. Define your brand profile, competitors and personas, then connect GA4 and Search Console. From there you manage your own themes, prompts and analytics across six engines, including ChatGPT, Perplexity, Gemini, Claude and Google AI Overviews.
- The Agent Atlas. Your team builds, versions and runs its own agents, and keeps them.
The reason that matters on this page: the statistics above describe the market, and none of them describes you. Our own measures are deliberately narrow. Brand Visibility is how often engines mention you by name. Domain Prompt Presence is how often they cite a page from your domain. The gap between them separates an awareness problem from a citability problem. For what the combination produces, the Acceldata case study records 6X organic traffic and top-three keywords rising from 85 to more than 300, mostly through B2B SaaS programmes.
Where it falls short: we do not publish our own aggregate benchmarks. So we cannot offer you a Pepper statistic to sit in the deck alongside Pew’s, and on this page’s own first test that is a weakness. Our tracked prompt set is large but it is our client base rather than a representative sample, so we describe it qualitatively and never derive a percentage from it. We are built for teams running organic as a long-term function. If you need one number for one slide this week, the sources above will serve you better than a call with us.
How to choose which statistics to use
I will write this in the first person, because a recommendation nobody will defend is worth nothing.
Start by deciding what the number is for, because the bar moves. A figure for an internal strategy discussion can be directional. A figure in a board paper, a press release or a published article has to survive somebody hostile opening the link. Most of the bad statistics I see were fine for the first use and then travelled.
So my order is: decide the audience, apply the four tests, then write the sample and the date next to the number in your own document. Here is the scorecard I would use, on a 100 point scale.
| Area | Weight | What a usable statistic demonstrates |
|---|---|---|
| The original is one click away | 30 | You can open the study, not a summary of it. If the trail runs through two blogs, assume there is nothing at the end of it. |
| The sample matches your question | 25 | US adults does not answer a UK B2B question. A retail sample does not answer a services question. Say so when you use it anyway. |
| The period is still the period you mean | 20 | Anything measured before mid-2025 describes a different set of search surfaces. Quote it as history or not at all. |
| Somebody measured it twice | 15 | A repeated measurement tells you whether you are looking at a trend or a single reading. Prefer series to snapshots. |
| The publisher’s interest is visible | 10 | Vendor research is not disqualified, it is disclosed. Say who benefits if the number is true. |
Five questions I would ask of any statistic before using it, in this order.
- “Who collected this, and can I open it?” A stronger source is one click away and names itself. A weaker one is a roundup citing a roundup, and this single question removes most of what circulates.
- “How many, who, and when?” Sample size, population and field dates. Any study worth quoting publishes all three.
- “Has anyone measured it more than once?” A series beats a snapshot. Muck Rack’s three editions are worth more than a single larger study.
- “Does the sample answer my question?” US retail data does not describe a UK software buyer. Use it and say so, or find something closer.
- “Who benefits if this is true?” Vendor research can be excellent. It should still be labelled, including ours.
Red flags, each one something that appears in real decks. A percentage with no year attached. “Studies show” with no study. A figure about AI search dated before mid-2025 quoted in the present tense. A single number for AI’s share of search, which does not exist. And a statistic whose source is a page that has since been deleted, which is why we screenshot the source at the moment of use.
Before you build a case on market numbers, get your own. Write 25 real commercial questions your buyers would type. Run each of those 25 prompts three times across every engine you care about, because engines are probabilistic and one run is an anecdote. Then give any fix 90 days before you judge it. Four worked examples for a mid-market B2B software company:
- “best data observability platform for enterprise”
- “how do I monitor data quality across Snowflake and Databricks”
- “what should I look for in a data observability vendor”
- “who competes with Monte Carlo in data observability”
The resulting numbers describe your category rather than the market, which is what a board actually wants. Checking whether your brand appears in AI search walks through it properly.
And the answer that loses Pepper the sale: if the only thing you need is a number for one slide, take Pew’s and stop. It is free, it is well made, it is published four years running, and you do not need a supplier to read it for you. Call us when the question becomes what to do about it.
It comes down to one principle: quote the sample alongside the number, every time. Every statistic on this page is written with its sample and date attached, ours included, because a figure without those is a rumour with a decimal point.
What nobody should promise you
- A single number for AI’s share of search. The surfaces are not the same unit and cannot be added together.
- A statistic that will still be current next quarter. Adobe’s figures move monthly and the category is moving with them.
- Market data that describes your category. Every study here is a population average. Yours will differ, sometimes by a lot.
- Attribution from an AI citation to closed revenue. Nobody has this yet, including us.
- That a big sample makes a study right for you. A trillion visits to US retail sites is a large sample of the wrong thing if you sell software in Europe.
Frequently asked questions
Is AI search growing in 2026?
Yes. The share of US adults using ChatGPT rose from 18% in 2023 to 44% in 2026 on Pew’s annual survey. Half now use some AI chatbot. And 42% say they use chatbots to search for information, not only to generate things.
How many people use AI chatbots to search?
About 42% of US adults, according to Pew Research Center’s survey of 5,119 adults fielded in February 2026. Separately, 60% say they read AI-generated summaries in search results, which is a larger group because it includes passive exposure.
Where do AI engines get their answers from?
Mostly from earned media. Muck Rack’s analysis of more than 25 million cited links found earned media accounts for 84% of AI citations and paid or advertorial content for 0.3%, with journalism alone making up 27% of cited sources.
Does AI-referred traffic convert better?
In US retail, yes, and it has for eleven consecutive months. Adobe Analytics reported AI-referred traffic converting 60% better than non-AI traffic in July 2026, with 53% higher revenue per visit, across more than a trillion visits.
Do people click links when Google shows an AI summary?
Less often, on the most-cited study. Pew found clicks on 8% of visits with an AI summary against 15% without. That data is from March 2025, so treat it as history rather than as a description of search today.
What is the AI search market share?
There is no reliable figure, and we would not trust one. An AI Overview sits inside a Google search and a ChatGPT answer replaces one. They are not the same unit, so any single percentage adds together things that cannot be added.
How do I check whether a search statistic is reliable?
Open the original in one click, confirm the sample size, population and field dates, check the period is still relevant, and prefer figures that have been measured more than once. If the trail runs through two blogs, assume there is nothing at the end of it.
Which AI search statistics are out of date?
The widely quoted AI Overviews click figures are from March 2025. Adobe’s 42% conversion advantage was superseded by 54% and then 60%. Anything about Google+ as a ranking factor predates its shutdown on 2 April 2019.
Where to go next
To turn these numbers into something about your own brand, the free AI visibility diagnostic is where to start. To understand what the earned media figure implies for your plan, our model of how engines find and quote you is the next read.
If you are working out the vocabulary rather than the numbers, the types of SEO in 2026 sorts the terms out. If you are costing the work, our generative engine optimization cost benchmarks collects 30 published prices.
Sources and further reading
Every source below was opened at its original on 22 September 2026 unless stated.
- Pew Research Center, “Americans’ Views on AI Chatbots, Smart Devices and AI’s Impact”, published 17 June 2026. American Trends Panel, 5,119 US adults, fielded 17 to 23 February 2026. ChatGPT use 18% in 2023, 23% in 2024, 34% in 2025, 44% in 2026. Any chatbot 49%, against 33% in 2024. 42% use chatbots to search, 60% read AI summaries, about 24% use a chatbot daily. US adults only, self-reported.
- Pew Research Center, “Google users are less likely to click on links when an AI summary appears in the results”, published 22 July 2025. 900 US adults on KnowledgePanel Digital, browsing data 1 to 31 March 2025, search results collected 7 to 17 April 2025, 68,879 searches of which 12,593 produced AI summaries. Clicks on 8% of visits with a summary against 15% without, and 1% clicked inside the summary. Quoted here as a finding about March 2025, not about 2026.
- Muck Rack, “What Is AI Reading?”, May 2026 edition. More than 25 million links cited in ChatGPT, Claude and Gemini responses across 17 industries. Earned media 84% of citations, paid and advertorial 0.3%, journalism 27%. Across three editions since July 2025, earned media has ranged 82% to 89% and journalism 25% to 27%. Muck Rack sells PR and media database software, so it has a commercial interest in this result. Not hyperlinked, per our policy on competitor and vendor links.
- Adobe Analytics, July 2026 figures, based on more than 1 trillion visits to US retail sites. AI-referred traffic up 62% year over year and 1,219% since October 2024. Conversion 60% better than non-AI traffic, the eleventh consecutive month of outperformance. Revenue per visit 53% higher, time on site 59% higher, bounce rate 33% lower, cart additions 28% more frequent. Adobe’s own pages timed out on our check on 22 September 2026, so these figures were read in Digital Commerce 360’s report of 19 August 2026 by Abbas Haleem. Adobe is the origin and a trade publication is where we read it.
- Google Workspace blog, “What you need to know about the sunset of consumer Google+ on April 2”. The consumer shutdown date used in the correction above.
- Google Search Central, “Optimizing your website for generative AI features on Google Search”, announced 15 May 2026, last updated 10 July 2026. The position that optimizing for generative AI search is still SEO.
Further reading on Pepper, each checked live on 22 September 2026:
- The half-hour AI visibility check, free and self-serve.
- Visibility, Citability and Retrievability, the model these numbers feed.
- Entity optimization and LLM visibility, what the earned media figure implies for your site.
- The types of SEO in 2026, if the vocabulary rather than the numbers is the problem.
A note on scope and on corrections. This page covers AI search statistics and how to check them. It does not restate the framework or the entity argument, both of which are linked. Four things from the previous version have been removed rather than updated: the Google+ ranking-factor claim, the unsourced organic-traffic share, the aggregator links used as sources, and the team byline. The previous version contained no AI search statistics of any kind, which is why this is a replacement rather than a refresh.
Latest Blogs
Most advice on this is inference dressed as fact. OpenAI documents exactly one thing clearly, which is access. Here is what is documented, what is inferred, and how to verify the rest for yourself.
Being named in an AI answer and having your page used as its source are different outcomes with different causes and different fixes. The gap between them is the most useful diagnostic in AI search, and most reporting collapses it into one number.
Every platform reports share of voice and almost none of them define it the same way. Here is the definition worth using, the three choices that change the number, and how to measure it yourself without buying anything.
Get your hands on the latest news!
