Is Google sending less traffic than before? What the data actually shows
The short answer
Yes on the queries where AI features appear, and the best evidence for that is a randomised experiment rather than a panel of dashboards. However, across a whole site the effect is usually much smaller than the headlines suggest, because most queries still do not trigger those features and impressions have risen. Furthermore, the traffic that does disappear is not showing up at AI engines, which remain under 1% of referrals. So the honest answer depends entirely on which question you are asking.
Key takeaways
- The strongest study is a preregistered field experiment, not a dashboard. In a 2026 experiment with 1,100 participants, being assigned to AI Mode cut click-through by 18.8 percentage points, and removing AI features raised it by 8.8 points.
- A natural experiment puts the everyday effect much lower. Using the staggered country rollout of AI Overviews, researchers found English Wikipedia search traffic fell 5.45% and 4.82% against German and French controls.
- Aggregate click counts have often held flat. In one 2026 analysis of 53 brands, clicks stayed at 398,000 to 400,000 while impressions more than doubled from 15.8 million to 33.1 million. The rate halved and nobody lost a visitor.
- Where traffic genuinely fell, your category matters more than the average. One study of 74 sites found declines from 39.3% in finance and insurance to 8.0% in retail.
- It is not going to AI engines. In the same study AI referrals tripled and still sit under 1% of total, and a peer-reviewed estimate puts them under 0.2%.
- Most circulating numbers fail a basic sourcing check. The widely quoted 60% clickthrough collapse is a ratio artefact, and the Wikipedia result is routinely reported as 15% when the paper says 5.45%.
- Pepper is an agentic organic growth engine and an organic growth partner. Agent Atlas puts the agents in your team’s hands. Pepper’s GEO platform reports Brand Visibility, Domain Prompt Presence and Share of Voice across six engines, including ChatGPT, Perplexity, Gemini and Google AI Overviews. A growth team works alongside yours. Eight years, more than 250 enterprises, more than 10 million tracked prompts.
A note on where this comes from. I get asked this question in board meetings, usually with a chart already on the screen and a number already in someone’s head. Pepper runs organic growth for more than 250 enterprises over eight years and tracks more than 10 million prompts across every major engine. In my experience the argument is rarely about what happened. It is about which of four incompatible statistics somebody read first.
Disclosure: Pepper sells services that help brands appear in AI answers, so “Google is sending less traffic” is a conclusion we profit from. This article reports that the best-identified estimates are smaller and narrower than the figures the category quotes, and that the missing traffic is not arriving at AI engines either. Every study below was read at the source, not via a summary. Competitors are named but never linked.
What is actually being claimed when people say Google sends less traffic?
The sentence hides at least three different claims, and the data answers them differently. So before looking at any number, it is worth separating them.
- Claim one, the rate. For a given query, a smaller share of searches now ends in a click. This is about click-through rate.
- Claim two, the volume. Your site receives fewer actual visits from Google than it did a year ago. This is about absolute clicks.
- Claim three, the destination. The visits you lost are now going to ChatGPT, Perplexity and other AI engines instead.
These come apart easily. A rate can halve while volume holds steady, as long as impressions grow. Volume can fall for reasons that have nothing to do with AI, such as content decay or a competitor outranking you. And the destination claim is separately testable, because referral traffic from AI engines is directly measurable in analytics.
Therefore the useful question is not “has traffic fallen”. It is “which of these three happened to me, and how confident can anyone be about it”.
How we weighted the evidence
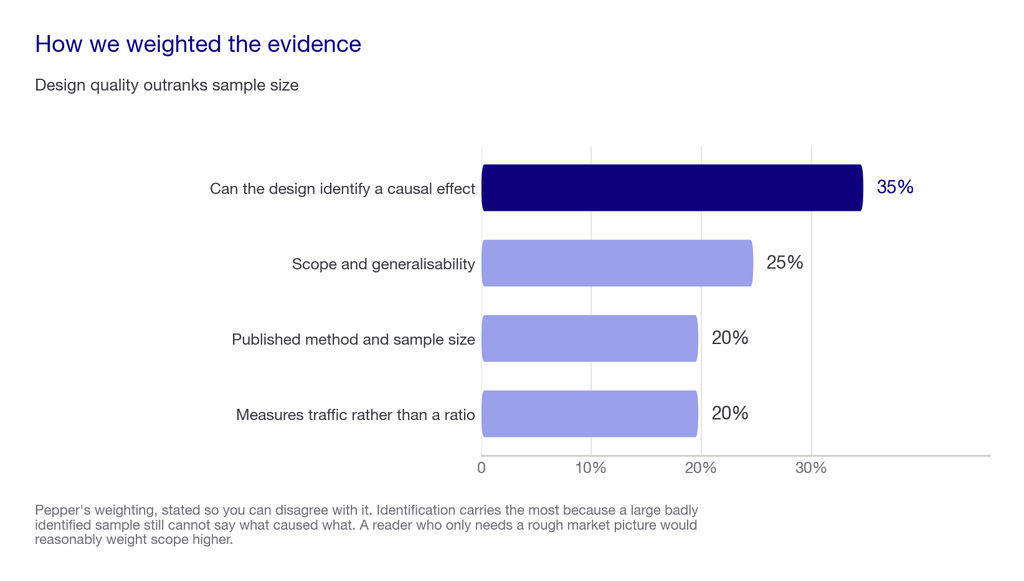
Not all of these studies deserve equal weight, and the differences are not about sample size. They are about whether the design can support a causal claim at all. So here is how we ranked them.
| Criterion | Weight | Why it carries that weight |
|---|---|---|
| Can the design identify a causal effect | 35% | A randomised or natural experiment can say AI caused the change. A dashboard cannot, however many rows it holds. |
| Scope and generalisability | 25% | A tightly controlled experiment on 1,100 people answers a narrow question very well. Breadth and rigour trade off. |
| Published method and sample size | 20% | If you cannot see how it was measured, you cannot tell whether it measured anything. |
| Measures traffic rather than a ratio | 20% | Click-through rate moves when impressions move. A rate change on its own proves nothing about lost visitors. |
The strongest evidence is a randomised experiment
The best-identified study here was published on 18 August 2026, by researchers at the University of Pennsylvania and Northeastern University. It is a preregistered field experiment with 1,100 participants on Google Search. People were randomly assigned to different search experiences, then observed.
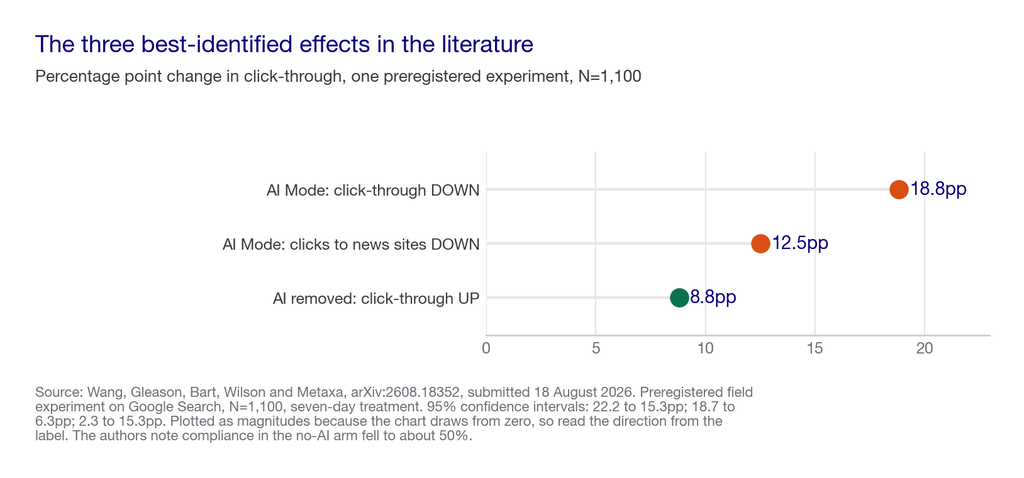
- Assignment to AI Mode reduced click-through by 18.8 percentage points, with a 95% confidence interval of 22.2 to 15.3 points and p below 0.001. That is a large, precisely estimated effect.
- It also cut the share of users clicking through to news sites by 12.5 points, interval 18.7 to 6.3.
- Removing AI features raised click-through by 8.8 points, interval 2.3 to 15.3, p equal to 0.008.
- It did not improve the experience. Trust in information on Google fell by 0.34 points on a 7-point scale, satisfaction by 0.73 standard deviations, and perceived usefulness by 0.59.
That last finding matters, because the usual defence of AI answers is that users prefer them. In this experiment they did not.
The authors are careful about the limits, and so are we. Compliance in the no-AI condition fell to roughly 50%. The treatment period was only seven days, which is too short to capture adaptation. The sample skews younger and more educated, and the study was underpowered for small secondary effects. So read 18.8 points as a well-identified estimate of a specific, forced condition rather than as the experience of your average visitor.
If you want someone to work through what this means for your own numbers rather than the average, book a growth audit and bring twelve months of Search Console data.
The second strongest is a natural experiment
Published 5 February 2026, this study uses a neat trick. Google rolled AI Overviews out to different countries at different times, and Wikipedia publishes the same articles in many languages. So researchers compared external search referrals to English Wikipedia articles against the same articles in German and French. The design is difference-in-differences.
The result: default AI Overview availability reduced English search traffic by 5.45% and 4.82% against the two control groups.
This number is far smaller than the experimental one, and both can be right. The experiment forced people into AI Mode for every query. The natural experiment measures something different: what happened when AI Overviews simply became available in a country, across all the ordinary searches people do. That gap, between 18.8 points under forced exposure and roughly 5% in the wild, is the most useful single fact in this article.
What the big observational panels show
Two 2026 panels cover far more sites, with far weaker identification. They are still worth reading, as long as you treat them as description rather than cause.
The first analysed 53 brands, 5.47 million queries and 2.43 billion impressions. In its sharpest month, clicks held flat at 398,000 to 400,000 while impressions more than doubled from 15.8 million to 33.1 million. Click-through is clicks over impressions. Hold the top still, double the bottom, and the rate halves without a single visitor being lost. The same analysis found AI Overview click-through recovering from 1.31% to 2.36%, and paid click-through on the same queries holding between 13.99% and 17.95% all year.
The second covered 74 websites across twelve industries. It found organic traffic down 20.3% year on year. However, that aggregate conceals almost everything interesting.
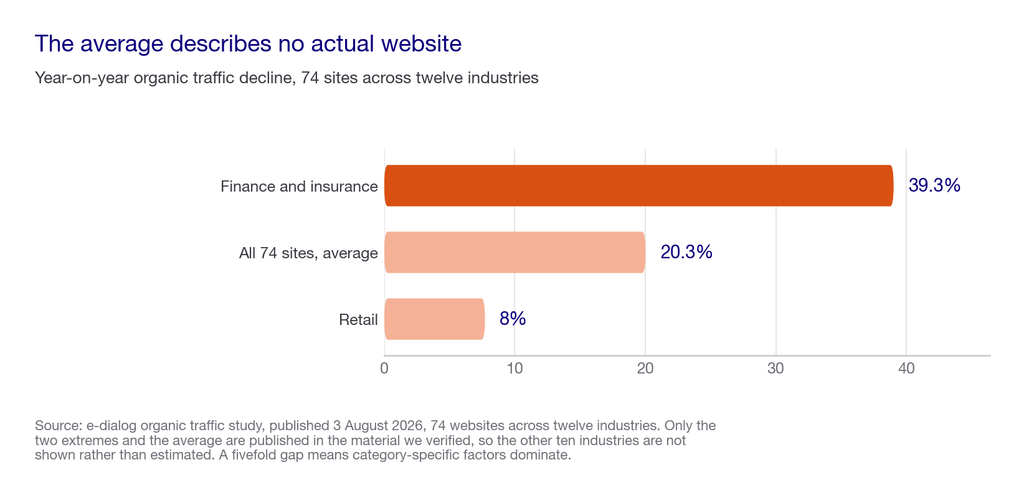
A fivefold spread between categories means category-specific factors dominate. Consequently the 20.3% average describes no actual website, and quoting it at your own leadership team is close to meaningless. The finance and insurance figure is the one we are asked about most. It is also the sector where we do most of this work, so our view of organic growth in BFSI is shaped by that number rather than the average.
Both panels agree on the destination question. AI referrals tripled and remain under 1% of total traffic. A peer-reviewed estimate puts them under 0.2%. Whatever is happening, the visitors are not reappearing somewhere else.
Why the numbers you keep seeing are mostly wrong
This is the part that prompted the article. The figures circulating in the trade press and on agency blogs do not survive contact with the papers they cite.
- The famous 60% click-through collapse is a ratio artefact. It comes from the panel above, whose own figures show clicks flat and impressions doubling. The rate fell. The traffic did not.
- The Wikipedia study is routinely reported as a 15% decline. The paper says 5.45% and 4.82%. We found the inflated figure in several secondary write-ups while researching this piece, and the error survives because almost nobody opens the paper.
- Figures like “35% drop” and “38% decline” usually have no traceable origin. They are quoted from blogs quoting blogs, and the trail ends without a method or a sample.
- The widely cited 8% versus 15% click comparison is real but out of scope here, because it was published in 2025 and describes a superseded generation of AI features. We apply a strict 2026 rule and have left it out.
The pattern is consistent. The larger and rounder the number, the less likely it is to have a method attached.
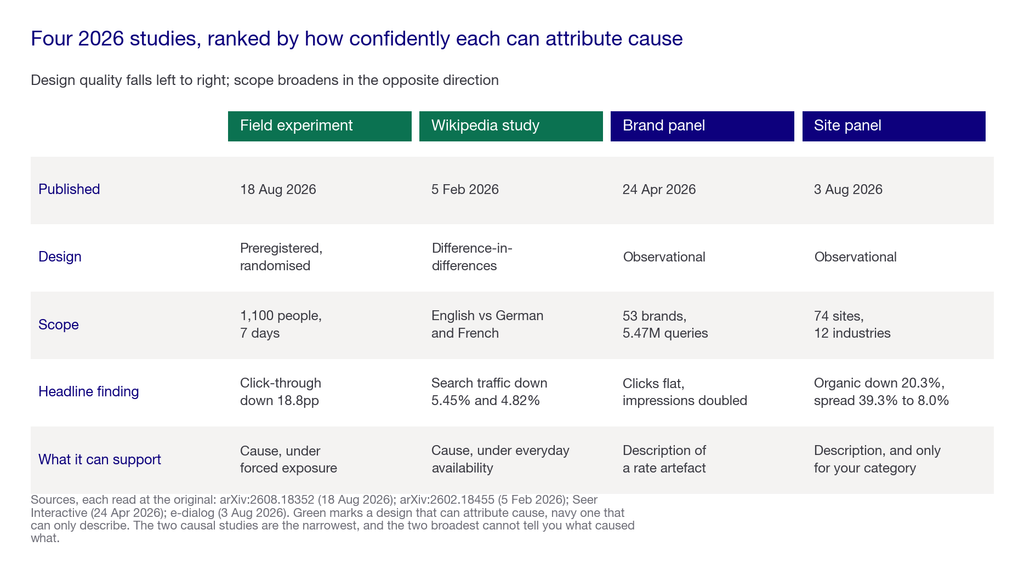
The evidence at a glance
| Study | Design | Scope | Headline finding | What it can support | Cost to replicate for your site |
|---|---|---|---|---|---|
| Field experiment, Aug 2026 | Preregistered, randomised | 1,100 people, 7 days | Click-through down 18.8pp under AI Mode | A causal claim about forced AI exposure | Not feasible, needs randomisation |
| Wikipedia study, Feb 2026 | Difference-in-differences | English vs German and French | Search traffic down 5.45% and 4.82% | A causal claim about everyday availability | Not feasible without a control group |
| Brand panel, Apr 2026 | Observational | 53 brands, 5.47M queries | Clicks flat, impressions doubled | Description of a rate artefact | Free, about 10 minutes in Search Console |
| Site panel, Aug 2026 | Observational | 74 sites, 12 industries | Organic down 20.3%, spread 39.3% to 8.0% | Description, and only for your category | Free, about an hour with analytics |
So, is Google sending less traffic to your site?
Here is how to turn all of that into an answer about your own site, in order.
- Check whether your clicks fell, or only your rate. Put clicks and impressions on one Search Console chart for eighteen months. If impressions rose while clicks held, your rate fell and your traffic did not. This takes ten minutes and costs nothing.
- Check your category, not the average. With a fivefold spread across industries, the only relevant benchmark is your own sector.
- Check whether AI features even appear on your queries. The causal effects above apply to queries that trigger AI Overviews or AI Mode. If yours do not, none of this is your explanation.
- Check your AI referral traffic directly. It is measurable in analytics, and if it is under 1%, the migration story is not what happened to you.
- Only then look at the other causes. Content decay, a competitor outranking you, and technical faults are all more common than people expect, and all are cheaper to rule out.
Our five-cause diagnosis for a traffic drop works through step 5 in detail, and our page on click-through decay covers the rate question.
What this costs
Answering this for your own site costs nothing but time. Step 1 is ten minutes, steps 2 to 4 are about an hour between them, and step 5 is roughly half a day if you do it properly.
Buying a view of AI engines is a separate decision. Published entry pricing in that category starts around $29 a month for very limited prompt counts and rises with engines and volume. However, none of it answers the Google question above, which is why we would run the free version first.
How Pepper fits
Pepper is an agentic organic growth engine and an organic growth partner, which means three things working together.
Pepper’s GEO platform is the self-serve workspace: brand profile, competitors, personas, GA4 and Search Console connected, themes and prompts defined. It reports Brand Visibility, Domain Prompt Presence and Share of Voice across six engines, including ChatGPT, Perplexity, Gemini and Google AI Overviews. That is how you answer step 4 continuously rather than once.
Agent Atlas is where your team builds, versions and runs its own agents, with quick runs for one input and sheet runs for bulk. It is well suited to the unglamorous half of this work: pulling eighteen months of query data apart by cluster, and separating rate changes from volume changes at scale.
The growth team is attached to the account and works alongside yours, which matters because the answer to this question is usually a content and corroboration programme rather than a dashboard.
Where it falls short: none of this tells you what Google will do next, and we have no privileged view of its roadmap. Our platform measures presence in AI answers, so it is strong on step 4 and silent on steps 1 to 3, which remain Search Console work. We would rather say that than imply the software answers the whole question.
Eight years, more than 250 enterprises, more than 10 million tracked prompts. You can see the shape of the work in the Acceldata case study, in how we run this for B2B SaaS brands, and across the case study library.
How to choose what to do about it
The decision is not whether the decline is real. It is how much of your budget should move, and on what evidence. So here are the criteria, weighted.
The weighted scorecard
Score each row from 1 to 5, multiply by the weight, and total out of 100.
| Criterion | Weight | Score 1 means | Score 5 means |
|---|---|---|---|
| Share of your queries that trigger AI features | 30 | Almost none, you are unaffected | Most of your head terms |
| Gap between your clicks trend and your impressions trend | 25 | They move together | Impressions up sharply, clicks flat |
| Your category’s measured decline | 20 | Retail-like, around 8% | Finance-like, approaching 39% |
| Share of revenue that starts with organic search | 15 | A minor channel | The primary pipeline source |
| AI referral share already visible in analytics | 10 | Under 0.2% | Above 2% and climbing |
Under 40, this is not your problem yet and you should spend the quarter on content. From 40 to 70, run the measurement properly and reallocate at the margin. Above 70, treat it as a channel shift and plan accordingly.
The weaker playbook against the stronger one
The weaker response is to take the biggest number in the trade press and build a slide around it. That is fast and it is persuasive internally. It will also be wrong, because the biggest numbers are the ones with no method attached. The stronger response is to reproduce the measurement on your own data first. Run your own clicks-versus-impressions chart, and your own category comparison. Then argue from that. One borrows somebody else’s conclusion. The other earns yours.
Run a live test before you reallocate budget
Before moving spend, test the premise on your own terms. Take 20 prompts that represent how your buyers actually search, written in their words rather than yours. Good examples look like “best project management tool for agencies”, “how do I reduce payment processing fees”, or “alternatives to the incumbent for a mid-market team”. Check whether each triggers an AI Overview at all. Then re-run the same set at 30 days and again at 90 days, and watch whether coverage is growing on your terms. If AI features never appear on your commercial queries, the causal studies above simply do not apply to you.
Red flags
- A statistic quoted without a sample size or a publication date
- A percentage from a vendor whose product solves the problem the percentage describes
- Any single number offered as the industry decline, given a fivefold category spread
- A click-through rate presented as evidence of lost traffic, with no impressions alongside
- A 2025 study presented as current, when the AI feature generation has since changed
- Agency decks that cite other agency decks
- Anyone certain about what Google will do next
Five questions worth asking anyone quoting a number at you
- What was the sample, and over what period was it measured?
- Is this a rate or a count, and if it is a rate, what happened to the denominator?
- Can the design support a causal claim, or is it describing a correlation?
- Who funded or published it, and do they sell the remedy?
- Has the paper itself been read, or is this a figure from a summary of a summary?
The reducing principle. It comes down to one question: did your clicks fall, or did only your rate fall? Everything else in this article is a refinement of that test. If clicks held and impressions grew, you have a reporting problem rather than a traffic problem, and no amount of strategy will fix a chart that was never broken.
The honest closing note. For many sites the correct conclusion after this work is that the decline is real but modest, concentrated in informational queries, and not worth a dramatic reallocation. If your clicks held and your commercial queries never trigger an AI Overview, you do not need us for this, and we would tell you so on the call. That is an unexciting finding and it does not sell a retainer. It is also, on the evidence, the most common one.
What nobody should promise you
- A single industry number for how much Google traffic has fallen. The category spread is fivefold, so any one figure is wrong for almost everybody.
- A recovery of traffic lost to a genuine answer box. If the query is fully satisfied in the result, that visit is not coming back.
- Certainty about causation from dashboard data. Only two studies here can support a causal claim, and neither is a dashboard.
- A forecast of Google’s next change. Nobody outside Google has this, ourselves included.
- That AI engines will replace the lost volume. At under 1% of referrals, they currently do not.
Where this stops working, including for us
The causal evidence is strong but narrow. The field experiment ran for seven days with 1,100 people. The sample skewed younger and more educated, and compliance in one arm fell to about half. The Wikipedia study is rigorous but measures a single informational publisher. Encyclopedia lookups are exactly the queries an answer box satisfies best. Neither tells you much about a high-consideration commercial purchase.
The observational panels have the opposite problem. They cover far more sites and cannot attribute cause at all.
And our own position deserves the same scepticism. Pepper sells the remedy to the problem this article describes, which is precisely the red flag listed above. We have tried to earn the benefit of the doubt by reporting the smaller well-identified numbers rather than the large loose ones, but you should discount us accordingly and check the sources yourself. They are all linked.
Where to go next
- To diagnose your own chart in order, read our five-cause traffic drop framework.
- For the rate question specifically, read our page on why clickthrough falls while clicks hold.
- For how the three levers work together in practice, see Pepper’s GEO platform.
- For what zero-click means in practice, read zero-click search.
- For the three levers that decide whether you get cited at all, read Visibility, Citability and Retrievability.
- To check whether AI engines mention you, read how to check if your brand appears in AI search.
Frequently asked questions
Is Google sending less traffic than before?
On queries where AI features appear, yes, and a randomised 2026 experiment measured an 18.8 percentage point fall in click-through under AI Mode. Across a whole site the effect is usually much smaller, because most queries do not trigger those features.
How much has Google traffic actually fallen?
There is no single credible figure. One 2026 study of 74 sites found 20.3% on average, but with a spread from 39.3% in finance to 8.0% in retail. That fivefold gap means your category’s number is the only one worth quoting.
Did clickthrough really drop 60%?
No, and this is the most misquoted statistic in the subject. It comes from a panel where clicks held flat at around 400,000 while impressions more than doubled. The rate halved for arithmetic reasons, and no visitors were lost.
Is my traffic going to ChatGPT instead?
Almost certainly not in any meaningful volume. AI referrals tripled in one 2026 study and still sit under 1% of total traffic, with a peer-reviewed estimate putting them under 0.2%. Check your own analytics, because it is directly measurable.
Do AI Overviews make users happier?
The one randomised experiment that measured this found the opposite. Assignment to AI Mode reduced trust in information on Google by 0.34 points on a 7-point scale, cut satisfaction by 0.73 standard deviations, and reduced perceived usefulness by 0.59.
Why do different studies disagree so much?
Because they measure different things. A forced-exposure experiment, a country rollout comparison and a dashboard of 74 sites answer three different questions. Design explains more of the variation between these studies than sample size does.
What should I check first on my own site?
Put clicks and impressions on the same Search Console chart for eighteen months. If impressions rose while clicks stayed flat, your click-through rate fell without any loss of visitors. That check takes ten minutes and costs nothing at all.
Will this get worse?
Probably somewhat, though nobody outside Google can tell you by how much. The honest position is that AI feature coverage has been expanding while measured click-through on those features has partially recovered, and those two trends point in opposite directions.
Sources and further reading
- Wang, Gleason, Bart, Wilson and Metaxa, AI in Search Reduces Publisher Referrals Without Improving User Experience, arXiv:2608.18352, submitted 18 August 2026. Preregistered field experiment, N=1,100, on Google Search, seven-day treatment. Source of the 18.8pp, 12.5pp and 8.8pp estimates and the trust and satisfaction measures. Authors note compliance fell to roughly 50% in the no-AI arm and that the sample skews younger and more educated.
- Khosravi and Yoganarasimhan, Impact of AI Search Summaries on Website Traffic, arXiv:2602.18455, submitted 5 February 2026. Difference-in-differences using the staggered geographic rollout of AI Overviews, comparing English Wikipedia referrals with German and French. Source of the 5.45% and 4.82% estimates.
- Seer Interactive AI search analysis, published 24 April 2026. 53 brands, 5.47 million queries, 2.43 billion organic impressions. Source of the flat clicks against doubling impressions, the AI Overview recovery from 1.31% to 2.36%, and the stable paid click-through.
- e-dialog organic traffic study, published 3 August 2026. 74 websites across twelve industries. Source of the 20.3% year-on-year decline, the 39.3% to 8.0% category spread, and the under-1% AI referral share.
- Kaiser and Schulze, Marketing Science, 2026, for the peer-reviewed estimate that AI referrals account for under 0.2% of visits.
- Pepper, the framework behind the three levers, for where citability sits in all of this.
- Pepper, what zero-click search means in practice, for the reader-facing version of the rate question.
- Pepper, the five-cause diagnosis, 1 October 2026, for applying this to a single site.
A note on sources. Only studies published in 2026 are cited. The frequently quoted 8% versus 15% click comparison was published in 2025 and describes a superseded generation of AI features, so it is excluded despite being directly on topic.
Latest Blogs
Is Google sending less traffic than before? On queries where AI features appear, yes, and a randomised experiment published in August 2026 puts the effect at 18.8 percentage points of click-through. Across a whole site the picture is much softer, because most queries do not trigger those features and impressions have grown. The traffic is also not migrating to AI engines, which still account for under 1% of referrals. This article ranks every 2026 study by how well it identifies the effect, rather than by how large its headline is.
Mentioned vs cited is the distinction most AI visibility reporting collapses, and the data says it should not. Across 3,981 brand appearances studied in June 2026, 61.7% were citations with no brand name in the answer, 25.1% were names with no citation, and only 13.2% were both. The split also inverts by engine: Gemini named brands in 83.7% of appearances but cited sources in 21.4%, while ChatGPT did almost the opposite. A single visibility score averages two different things across engines that behave in opposite ways.
How AI search actually works is usually described as a tidy pipeline: you ask, it searches, it reads, it answers, it cites. Each of those five stages behaves differently from the description. In one 2026 pilot the engine searched the web on only 42% of buying prompts. When it did search, it ran an average of 6.3 queries nobody wrote. And in a 2,100-question evaluation across six chatbots, retrieval rather than reasoning drove more than 70% of all errors. This article walks the real pipeline and marks what breaks at each step.
Get your hands on the latest news!