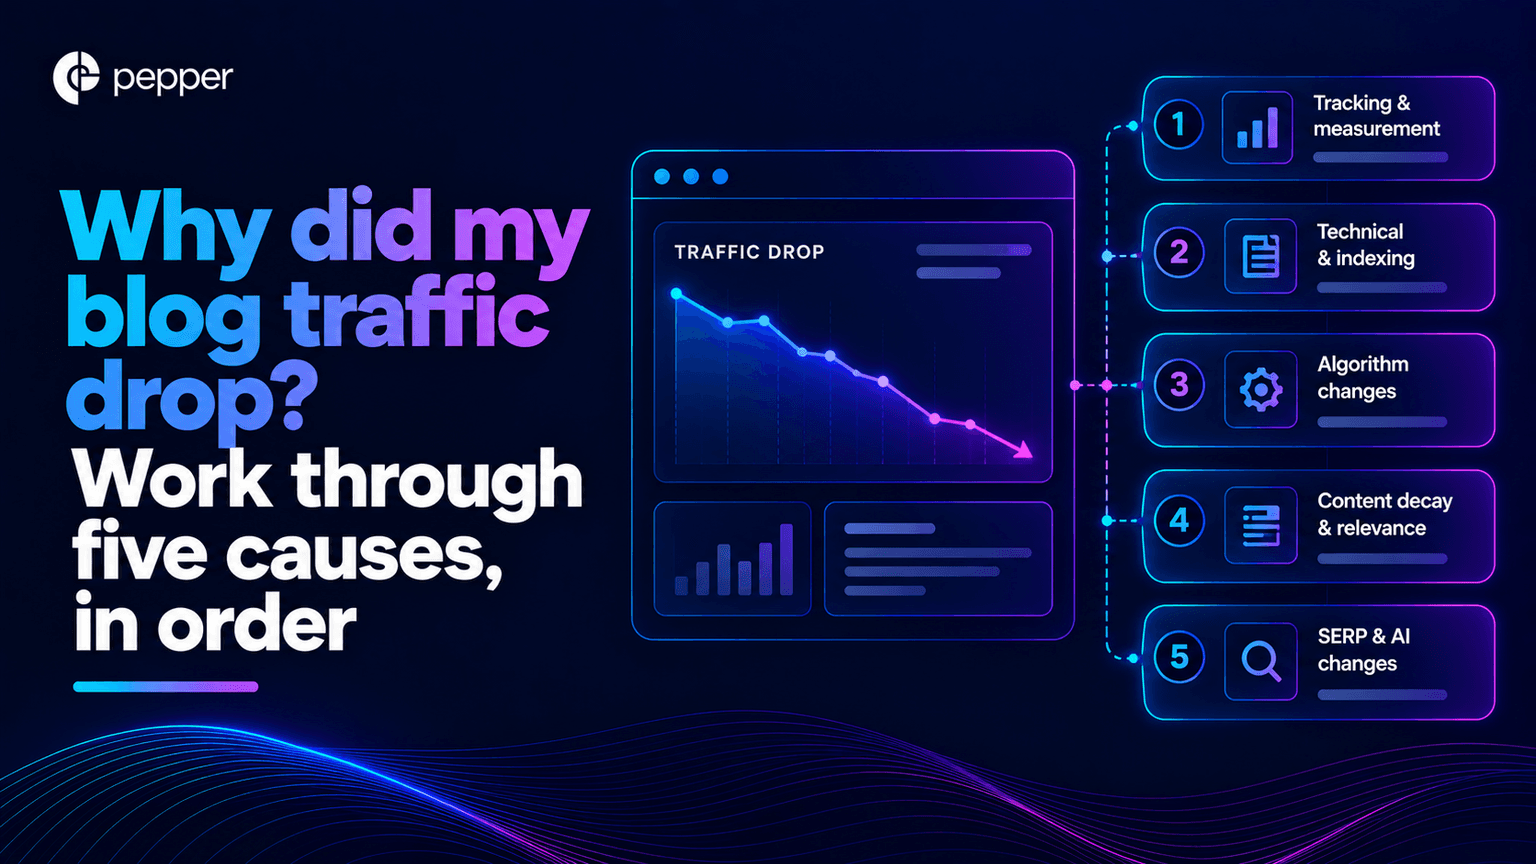
Why did my blog traffic drop? Work through five causes, in order
The short answer
A blog traffic drop has five plausible causes, and AI search is the one people reach for first because it is the most interesting. It is also the only one with no direct measurement, so it belongs last, diagnosed by elimination. Start with the free ten-minute check, because a large share of reported drops are partly a reporting artefact rather than lost visitors.
Key takeaways
- Check whether the drop is real before explaining it. Clickthrough can fall while clicks hold steady, because impressions inflate. In one 2026 study of 53 brands and 5.47 million queries, clicks stayed flat at 398,000 to 400,000 while impressions more than doubled from 15.8 million to 33.1 million.
- Test the five causes in order of how cheap they are to rule out, not in order of how interesting they are.
- AI search is the residual. There is no metric that says “the answer box satisfied this query”, so you reach that conclusion by eliminating the other four, never by starting there.
- It also explains less than people assume. In one study of 74 sites, AI referral traffic tripled and still sits under 1% of total. Traffic is not migrating to AI engines; demand is being met without a visit.
- Category matters more than anything else. The same study found declines ranging from 39.3% in finance and insurance to 8.0% in retail. Your category’s number is not the industry’s number.
- Content decay is the cause most often missed, because it is gradual and nobody gets an alert for it.
- Pepper is an agentic organic growth engine and an organic growth partner. Agent Atlas puts the agents in your team’s hands. Pepper’s GEO platform reports Brand Visibility, Domain Prompt Presence and Share of Voice. A growth team works alongside yours. Eight years, more than 250 enterprises, more than 10 million tracked prompts.
A note on where this comes from. I get handed traffic charts and asked what happened, and the honest first answer is usually that we do not know yet. Pepper runs organic for more than 250 enterprises over eight years and tracks more than 10 million prompts across every major engine. The most common mistake I see is not a wrong diagnosis. It is a diagnosis reached in the wrong order, starting with the explanation that makes the best slide.
Disclosure: Pepper sells services that help brands appear in AI answers, so “AI search took your traffic” is a conclusion we profit from. This article puts that cause last and says plainly that it explains less than the category claims. Every figure is traced to a named study with its sample size. Competitors are named but never linked.
What is behind a blog traffic drop in 2026?
Five things, and they are not equally likely or equally easy to test.
- A measurement artefact. The number fell, the visitors did not.
- Content decay. Pages that used to earn traffic stopped, gradually, with no single event to point at.
- A competitive or ranking loss. Somebody else now occupies the positions you held.
- A technical fault. Indexation, rendering or crawl access broke, often silently.
- Zero-click and AI search. The query is now answered without a visit.
The order matters more than the list. First, four of these can be tested directly, cheaply, with data you already own. The fifth cannot be measured at all, which means it should be concluded rather than assumed.
Our glossary entry on clickthrough decay defines the phenomenon, and our diagnostic for AI visibility gaps covers the related but different question of why a competitor appears in answers and you do not. This article is the traffic version.
Start with the free check: is the drop even real?
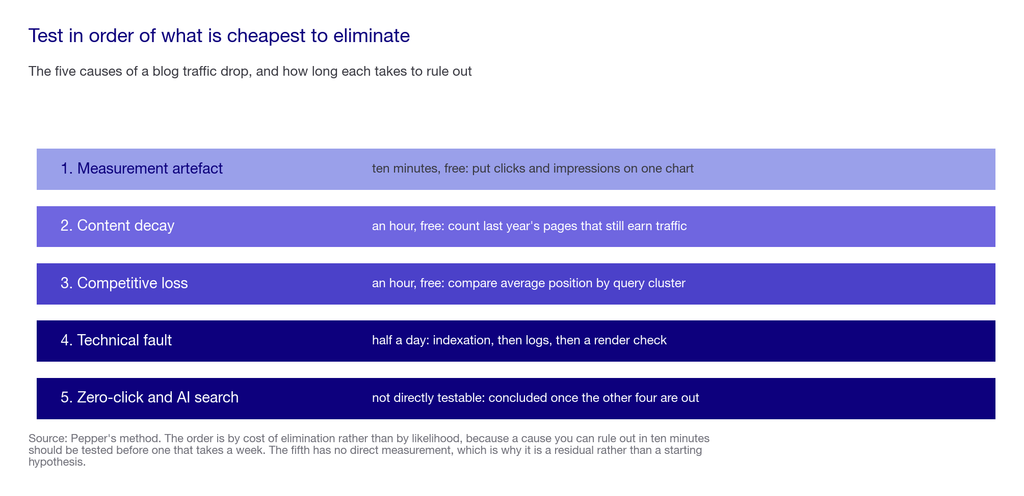
First, the free one. Ten minutes, no tools, and it resolves a surprising share of cases.
Open Search Console and put clicks and impressions on the same chart for eighteen months. You are looking for one specific pattern: impressions rising while clicks hold flat or fall gently.
So if that is what you see, a meaningful part of your “drop” is a ratio problem. Clickthrough rate is clicks divided by impressions. Double the denominator and the rate halves whether or not a single visitor was lost.
This is not a hypothetical. An analysis of 53 brands, 5.47 million queries and 2.43 billion organic impressions, published 24 April 2026, found that in the sharpest month clicks were essentially flat at 398,000 to 400,000 while impressions more than doubled from 15.8 million to 33.1 million.
Two further findings from the same study are worth knowing before you panic. Organic clickthrough on queries with an AI Overview recovered from 1.31% in December 2025 to 2.36% in February 2026. And paid clickthrough on those same queries held between 13.99% and 17.95% all year.
What to conclude. Then, if your sessions are genuinely down, keep going through the list. If only your clickthrough rate is down and sessions are broadly flat, you have a reporting problem rather than a traffic problem, and the fix is a chart change.
Where it falls short: this study covers 53 brands weighted toward companies buying enterprise search tooling, and the clicks-versus-impressions comparison is one month rather than the full dataset. It establishes that the artefact is real and common, not that it explains your particular chart.
If you would rather have someone separate the artefact from the real loss in your own data, book a growth audit and we will do it with you.
The five causes in the order you should test them
1. The measurement artefact
- What it looks like. Clickthrough down sharply, while sessions hold flat or fall mildly and impressions rise.
- How to test it. Clicks and impressions on one chart, eighteen months. Ten minutes.
- Why it happens. AI Overviews and expanded results surface you on far more queries than before, most of which were never going to click.
- What to do. So change the report, not the strategy. Put impressions beside clickthrough permanently.
- Where it falls short: it rarely explains the whole drop. Treat it as the portion to subtract before diagnosing the rest.
2. Content decay
- What it looks like. No single cliff. A slow slide concentrated in pages published eighteen months or more ago.
- How to test it. Take the pages that earned meaningful traffic four quarters ago and count how many still do. That fraction, subtracted from one, is your decay rate.
- Why it happens. Because information ages, competitors publish fresher versions, and nothing sends you an alert.
- What to do. Fund a refresh programme sized against the measured rate. Our compounding organic growth engine sets out the arithmetic, including why halving decay raises your ceiling as much as doubling output.
- Where it falls short: decay is confounded by algorithm updates and seasonality, so one cohort proves little. You need two or three publishing cohorts before the shape is trustworthy.
3. A competitive or ranking loss
- What it looks like. Specific pages and query clusters fell while the rest held. Position data moved.
- How to test it. Compare average position by query cluster across the period. Then search the queries and see who is there now.
- Why it happens. Because someone published something better, earned more links, or a core update revalued the space.
- What to do. Fix or retire the specific pages. This is a page-level problem with a page-level answer.
- Where it falls short: position data is averaged and personalised, so it is directionally useful and precisely unreliable.
4. A technical fault
- What it looks like. A step change rather than a slide, often dated to a release.
- How to test it. Indexation status by template in Search Console, then server logs for crawl frequency, then a render check on the templates that matter.
- Why it happens. Usually a deploy changed rendering, a robots rule shipped, or a migration dropped redirects.
- What to do. Fix it immediately, before anything else on this list. Our 47-check enterprise audit framework covers the checks in order.
- Where it falls short: a crawler export tells you what a crawler found, not what an engine did. Logs are the only evidence of what actually happened.
5. Zero-click and AI search
- What it looks like. Impressions holding, positions holding, sessions down, concentrated in informational queries.
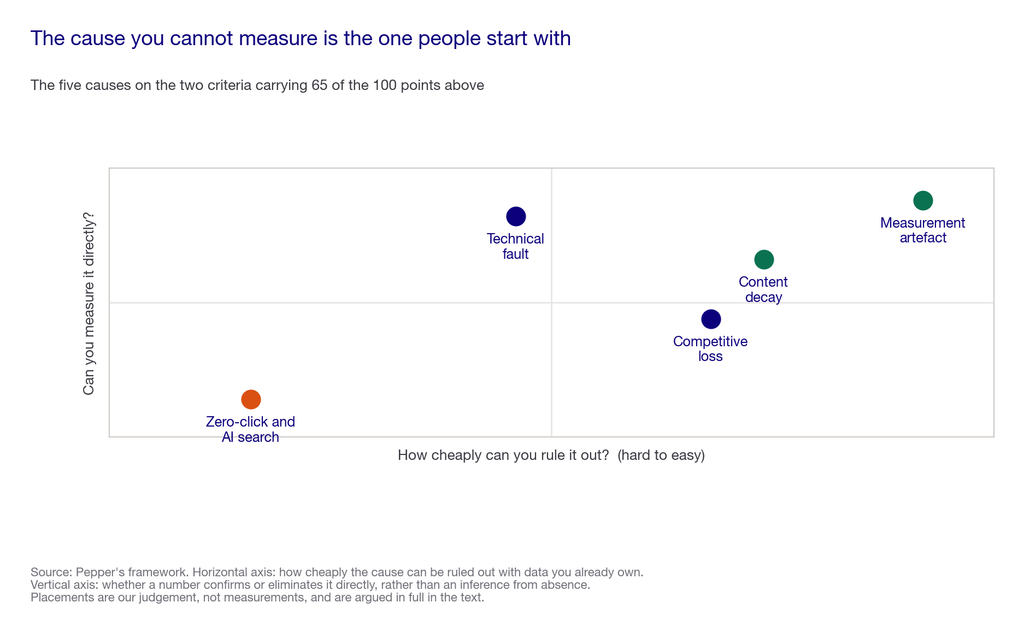
- How to test it. You cannot test it directly. You conclude it when the other four have been ruled out and the loss is concentrated in queries an answer box can satisfy completely.
- Why it happens. Because the answer is delivered in place, which is the product working as designed rather than failing.
- What to do. Stop funding content that an answer box replaces permanently, and move measurement to presence inside answers. Our note on the visibility strategy that still works covers the response.
- Where it falls short: because it is a residual, it also absorbs every error in the other four diagnoses. If you were sloppy above, this is where the sloppiness ends up.
How we weighted the causes
Four criteria, fixed before any diagnosis. They are our priorities, not measured coefficients.
| Criterion | Weight | What it means |
|---|---|---|
| Cheap to rule out | 35 | You can test it with data you already own, in under an hour, without buying anything |
| Directly measurable | 30 | There is a number that confirms or eliminates it, rather than an inference from absence |
| Commonly the actual cause | 20 | It shows up frequently in real diagnoses, rather than being theoretically possible |
| Actionable once confirmed | 15 | Knowing it changes what you do next, rather than only explaining the past |
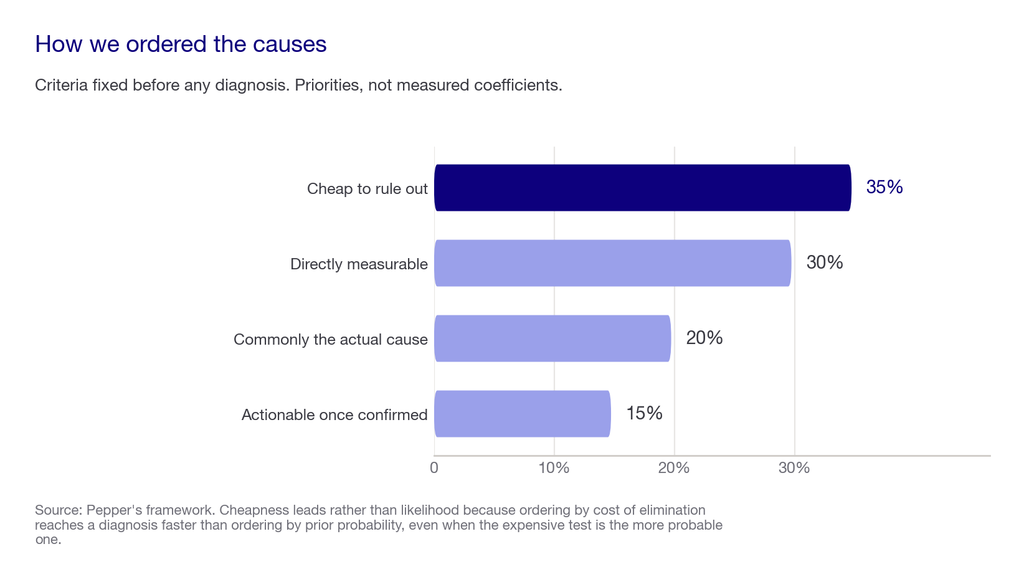
Why cheapness leads rather than likelihood. In practice, a cause that takes ten minutes to eliminate should be tested before one that takes a week, even if the week-long one is more probable. Ordering by cost of elimination gets you to the answer faster than ordering by prior probability.
Where it falls short: this ordering optimises for speed to diagnosis rather than for depth. A team that already knows its decay rate should skip straight to the causes it has not measured.
What the AI search explanation actually explains
The commissioned version of this question assumes AI search is the answer. In fact it is a real cause, and it is smaller than the conversation suggests.
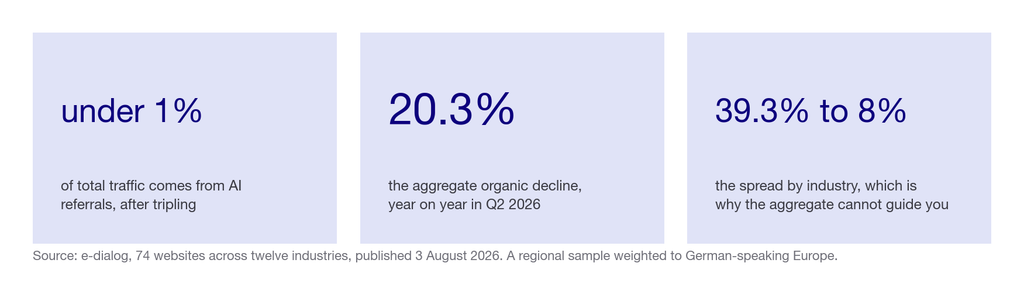
An analysis of 74 websites across twelve industries, covering quarterly data from Q1 2024 to Q2 2026, found organic traffic down 20.3% year on year in Q2 2026. Three things in that study bear directly on this diagnosis.
- AI referral traffic tripled over the period and still accounts for under 1% of total traffic. A peer-reviewed study of 973 e-commerce sites puts AI referrals at under 0.2% of visits. So traffic is not migrating to AI engines. Where it is genuinely lost, it is being satisfied upstream without a visit.
- The decline is wildly uneven: 39.3% in finance and insurance, over 30% in education, just under 20% in tourism, and 8.0% in retail. A single channel-wide force does not produce a fivefold spread. Category-specific factors are doing much of the work.
- Which means the aggregate number is close to useless for your diagnosis. Quoting 20.3% at your board tells them about German-speaking Europe across twelve industries, not about you.
The honest position. So AI search is a genuine cause, it is concentrated in informational queries, and for most businesses it is not the largest of the five. Reaching for it first is how teams end up funding a recovery project for traffic that a technical fault removed.
Where it falls short: 74 sites is a real sample but a regional one, weighted to German-speaking Europe. Read it as a strong signal on direction and on the size of the spread rather than as a figure to quote.
Traffic drop causes at a glance
| Cause | How it looks | Time to test | What it costs to test | Where it falls short |
|---|---|---|---|---|
| Measurement artefact | CTR down, sessions flat, impressions up | 10 minutes | Free, in Search Console | Rarely the whole story |
| Content decay | Slow slide in older pages | An hour | Free, from Search Console cohorts | Confounded by updates and seasonality |
| Competitive loss | Specific clusters fell, positions moved | An hour | Free, plus a crawler if you have one | Position data is averaged and personalised |
| Technical fault | Step change, often dated to a release | Half a day | Free to about $200 a month for a crawler | A crawler shows what it found, not what an engine did |
| Zero-click and AI search | Impressions hold, sessions fall, informational queries | Cannot be tested directly | Free, but only as a residual | Absorbs every error made above it |
| All five, properly | A defensible answer | About a day | Analyst time, no software | Still a diagnosis rather than a certainty |
## What the diagnosis costs
- The first four causes cost nothing but time. Everything you need is in Search Console, your analytics and your server logs.
- About a day of one analyst’s time gets you through all five properly, which is less than most teams spend arguing about the chart.
- A crawler licence, if you do not have one, runs to about $200 a month, and only the technical step needs it.
- Prompt tracking, if you want to measure presence in answers rather than infer it, starts around $29 a month at published entry tiers.
- The expensive mistake is free to avoid. Commissioning a content programme to recover traffic that a robots rule removed is the most costly outcome available, and it starts with skipping step four.
How Pepper fits
Pepper is an agentic organic growth engine and an organic growth partner, and on this topic our commercial interest points the wrong way, which is worth stating first.
- We sell the AI answer. “AI search took your traffic” is the conclusion that leads to buying what we sell, and this article puts it last and sizes it down. Read our framing with that in mind.
- Pepper’s GEO platform measures the fifth cause rather than inferring it. Brand Visibility for how often engines mention you, Domain Prompt Presence for how often they cite a page from your domain, and Share of Voice for your slice of the category. Those turn a residual into something observable. See the platform.
- Agent Atlas carries the repeatable parts of the diagnosis. Decay cohorts, indexation checks and prompt re-runs are workflows rather than a quarterly scramble. System agents stay fixed, user agents stay editable and versioned, and customers log in and build and run their own inside Atlas.
- A growth team works alongside yours on the part that takes judgement, which is deciding what is worth recovering and what is genuinely gone.
- Proof rather than adjectives. Acceldata went from 85 to more than 300 top three keywords with 6X organic traffic growth. More in our case studies, and the B2B SaaS practice.
Where Pepper falls short. Four of the five causes here are work we would not charge you for, and the first four are the ones most likely to explain your chart. We are useful on the fifth and on the response to it, which is a narrower claim than the category usually makes.
How to choose who diagnoses a traffic drop
I would judge any adviser on the order they work in, because the order reveals whether they are diagnosing or selling.
The framing judgement first, anchored outside my own view. Google’s guidance on optimising for generative AI features states that optimising for generative AI search is still SEO, running on core ranking systems with no separate index, and it advises against providers guaranteeing rankings because no external party has access to those systems. Read that as a reason to be suspicious of anyone treating AI search as a separate diagnosis requiring separate tooling. Then hold the other half, which is that Google documents Google, and the assistants answering complex questions publish nothing comparable.
The Pepper view on top is narrower. An adviser who reaches for AI search in the first meeting has told you what they sell, not what happened.
Here is the 100 point scorecard I would run over anyone diagnosing this, including us.
| Area | Weight | What a strong adviser demonstrates |
|---|---|---|
| They separate artefact from loss first | 30 | The opening move is clicks against impressions, and they tell you what share of the fall is arithmetic before proposing anything |
| They measure decay | 25 | They compute your decay rate from your own cohorts rather than quoting an industry figure |
| They check technical before strategic | 20 | Indexation and rendering are verified before any content recommendation is made |
| AI search is concluded, not assumed | 15 | It appears as a residual after elimination, with the reasoning shown |
| They will tell you part of it is not recoverable | 10 | The plan names the traffic that is gone for good rather than promising full recovery |
**Then run the live test, on us as readily as on anyone else.** Give any adviser eighteen months of Search Console data and 25 of your own buying questions, and ask for a written split of the decline across the five causes. Hold the answer for 90 days before acting on it, because engines and rankings both drift and a single reading proves nothing. Ask for specifics. For example: “what share of this is the denominator”, “what is our decay rate”, “which templates lost indexation”, “what would you not try to recover”.
Ask them to come back with five things. The artefact share. The decay rate. The pages that lost position. Any technical fault, dated. And the residual they are attributing to AI search, with the reasoning.
An adviser who hands you a split with a residual has diagnosed it. By contrast, one who hands you a narrative has not.
The weaker way to do this, and it is the common one. See the chart fall. Read something about AI Overviews. Commission a content programme. Discover in month three that a release in April changed rendering on the template carrying 40% of the traffic.
The stronger sequence. Separate artefact from loss. Measure decay. Check positions. Check indexation and rendering. Attribute the residual. Then decide what is worth recovering. The distinction matters because the first sequence buys a remedy for a cause nobody established, and the second establishes the cause first.
Red flags, each one something an adviser actually does.
- AI search named as the cause in the first meeting, before any of your data has been opened.
- No impressions line anywhere in the analysis.
- An industry decline figure quoted at you as though it described your category, when the spread runs from 8% to 39.3%.
- A content recommendation before an indexation check. Technical faults are cheaper to find and more likely to be the step change.
- A promise of full recovery, when some of the traffic was satisfied upstream and is not returning.
- A decay rate quoted as a benchmark rather than computed from your own cohorts.
- A guarantee of rankings, which Google itself advises against.
Five questions worth asking, and what a good answer sounds like.
- “How much of this is the denominator?” A good answer is a percentage from your own data. A bad answer is that CTR is down everywhere.
- “What is our decay rate?” A good answer computes it from your cohorts. A bad answer quotes an industry average.
- “Which templates lost indexation?” A good answer has already checked. A bad answer proposes content first.
- “What are you attributing to AI, and how did you get there?” A good answer shows the elimination. A bad answer asserts it.
- “What is not coming back?” A good answer names something. A bad answer promises full recovery.
If I reduce this to one principle: diagnose in order of what is cheapest to eliminate, not in order of what makes the best explanation. The interesting cause is almost never the first one to check.
The honest note that costs us something. Very few advisers are strong at measurement, technical diagnosis, content execution and AI visibility at once, and we would not claim uniform strength across all four either. On this particular question our incentive is misaligned, because the cause we are best placed to help with is the one that should be tested last.
What nobody should promise you
Nobody should name AI search as your cause before opening your data. It is the only one of the five with no direct measurement, which makes it the easiest to assert and the hardest to disprove.
Nobody should quote an industry decline figure as though it described your category. The spread in the study we trust runs from 8.0% to 39.3%.
Nobody should promise full recovery. Where an answer box now satisfies the query completely, those visits are not returning, and a plan to recover them spends money on demand that no longer exists in that form.
Nobody should promise a ranking for a fee. Google advises against providers who guarantee rankings, because no external party has access to the ranking systems.
Where this stops working, including for us
If your drop is a single step change dated to a deploy, skip the whole order and go straight to the technical check. The sequence above is for gradual declines with no obvious trigger.
If you have less than a year of Search Console history, the decay step is not available to you, and you should say so in the diagnosis rather than substituting a benchmark.
If your traffic is concentrated in branded queries, you do not need an AI search diagnosis and should not buy one. None of this applies in the same way. You are probably looking at a brand or competitive problem rather than a search one.
Where Pepper falls short. Four of these five causes are work we do not sell, and they are the more likely explanations. We are genuinely useful on the fifth, and saying so narrows our claim considerably.
Where to go next
Put clicks and impressions on the same chart today. For a meaningful share of teams, that single view changes the conversation before any work is commissioned.
Then work down the list in order, rather than jumping to the end. For the adjacent decisions, our model for building a compounding organic programme covers the decay arithmetic, our 47-check audit framework covers the technical checks in order, our SEO growth audit covers auditing the whole programme rather than one chart, and which KPIs to use for GEO covers what to report once you know. To see whether you appear in the answers replacing your clicks, see where you show up.
Frequently asked questions
Why did my blog traffic drop?
There are five plausible causes: a measurement artefact, content decay, a competitive or ranking loss, a technical fault, and zero-click AI search. Test them in that order, because the first four are cheap to rule out and the fifth cannot be measured directly.
Is AI search the reason my traffic fell?
Sometimes, and less often than the conversation suggests. AI referral traffic tripled in one 2026 study and still sits under 1% of total, so traffic is not migrating to AI engines. Conclude it by elimination, not assumption.
Why is my clickthrough rate down but sessions flat?
Because impressions inflated. In one study of 53 brands, clicks held at around 400,000 while impressions more than doubled, so the rate halved without a visitor being lost. That is a reporting problem, not a traffic problem.
How do I measure content decay?
Count the pages that earned meaningful traffic four quarters ago, then count how many still do. Subtract that fraction from one for your annual decay rate. It needs a year of Search Console history.
How much has organic traffic fallen in 2026?
One study of 74 sites found 20.3% year on year in Q2 2026, but the spread ran from 39.3% in finance and insurance to 8.0% in retail. The aggregate is close to useless for diagnosing your own site.
Should I check technical issues or content first?
Technical, always. A technical fault produces a step change, is cheaper to find, and is more often the cause of a sudden drop. Commissioning content before checking indexation is the most expensive mistake available.
Can traffic lost to zero-click be recovered?
Where the answer box genuinely satisfies the query, no. Those visits are not returning in that form. The realistic response is to be present inside the answer and to move measurement away from session counts.
How long should a proper diagnosis take?
About a day of one analyst’s time for all five causes, using data you already own. That is usually less than teams spend debating the chart before anyone opens Search Console.
Sources and further reading
- Seer Interactive, the impact of AI Overviews on Google clickthrough, 2026 update, published 24 April 2026. Method: 53 brands, 5.47 million queries, 2.43 billion organic impressions and 296.9 million paid impressions, January 2025 to February 2026. Source of the clicks-versus-impressions figures, the recovery in AI Overview clickthrough from 1.31% to 2.36%, and the stability of paid clickthrough between 13.99% and 17.95%. Limitations: 53 brands weighted toward companies buying enterprise search tooling, and the clicks-versus-impressions comparison covers one month.
- e-dialog, organic traffic study of the DACH region, published 3 August 2026. Method: 74 websites across twelve industries, quarterly data Q1 2024 to Q2 2026. Source of the 20.3% decline, the industry spread from 39.3% to 8.0%, and the finding that AI referral traffic tripled while remaining under 1% of total. Limitations: a regional sample weighted to German-speaking Europe, which is why this article warns against quoting the aggregate.
- Maximilian Kaiser and Christian Schulze, “Frontiers: ChatGPT Referrals to E-Commerce Websites”, Marketing Science, 2026. 973 e-commerce websites. Source of AI referrals at under 0.2% of all visits. Limitations: e-commerce only.
- Pepper, how to build a compounding organic growth engine. The decay arithmetic used in cause two, including the library ceiling model.
- Pepper, the enterprise SEO audit framework. The technical checks used in cause four, in order.
- Pepper, why is my competitor showing up in ChatGPT and not me. The related diagnostic for AI visibility gaps, which is a different question from a traffic drop.
- Google Search Central, guide to optimizing for generative AI features, page last updated 10 July 2026. Source of the advice against guaranteed rankings.
- The five-cause ordering, the weighting and the diagnostic sequence are ours.
What is not here, and why. No percentage split of how much each cause typically explains, because it varies by site and any figure we published would be invented. The article gives you the order to test in and leaves the split to your own data. No industry benchmark decay rate, for the same reason, and because the one 2026 study we trust shows a fivefold spread across categories. No claim that AI search is not a real cause, which the evidence does not support either: it is real, concentrated in informational queries, and smaller than the conversation implies.
Latest Blogs
You can check if your brand appears in AI search in about twenty minutes, on two engines, without paying for anything. The method is simple and the result is noisier than most people admit. In one 2026 pilot, ChatGPT searched the web on only 42% of buying prompts, so on the rest there was no retrieval event at all. In another, rewording a question changed the answer more than 23% of the time. This article gives you the check, then gives you the four reasons it can lie, so you can tell a real absence from a bad sample.
A blog traffic drop has five plausible causes and AI search is the most interesting one, which is exactly why people reach for it first. It is also the only one you cannot measure directly, so it should be diagnosed last, by elimination. The first check takes ten minutes and costs nothing: put clicks and impressions on the same chart. In one 2026 study of 53 brands, clicks held flat at around 400,000 while impressions more than doubled, so clickthrough halved without a single visitor being lost. Work through the other four before you conclude anything about AI.
Google publishes one eligibility rule for AI Mode, and in May 2026 it published what AI Mode users actually do. Both matter more than the fan-out arithmetic the category quotes.
Get your hands on the latest news!