Organic growth in 2026: how to build a compounding organic growth engine
The short answer
An organic growth engine compounds when the assets you build each quarter outlast the ones that decay. Most do not. In 2026 the aggregate numbers are down, and the reason is not that traffic moved to AI engines. Your library has a ceiling equal to your publishing rate divided by your decay rate, and cutting decay raises that ceiling exactly as much as doubling output does. Usually for less money.
Key takeaways
- Compounding is not a property of the channel. It is a property of a system. Organic can compound, flatline or shrink, and which one you get is decided by numbers you can measure this week.
- The 2026 numbers are down. A study of 74 sites across twelve industries found organic traffic fell 20.3% year on year in Q2 2026. Finance and insurance fell 39.3%. Retail fell 8.0%.
- The traffic is not moving to AI engines. In that same study, AI referral traffic tripled and still sits below 1% of total traffic. It is not migrating. It is disappearing.
- The stat everyone repeats is a ratio artefact. “AI Overviews cut clickthrough 61%” comes from a study whose own figures show clicks flat at about 400,000 while impressions more than doubled. The clicks did not go. The denominator grew.
- Your library has a ceiling. Publish 20 pages a quarter against 10% quarterly decay and it plateaus near 200 pages, whatever you spend after that.
- Halving decay raises the ceiling as much as doubling output. One of those costs a refresh programme against pages you already own. The other costs twice the content budget.
- Pepper is an agentic organic growth engine and an organic growth partner. Agent Atlas puts the agents in your team’s hands. Pepper’s GEO platform reports Brand Visibility, Domain Prompt Presence and Share of Voice. A growth team works alongside yours. Eight years, more than 250 enterprises, more than 10 million tracked prompts.
A note on where this comes from. I spend most of my time on the question of what changes when a channel’s economics change, and organic’s economics changed twice in eighteen months. Pepper runs organic for more than 250 enterprises over eight years and tracks more than 10 million prompts across every major engine. The pattern we keep hitting is that programmes do not fail because the work is bad. They fail because nobody ever checked whether the arithmetic underneath them adds up.
Disclosure: Pepper describes itself as an agentic organic growth engine, so we are defining a term we also brand ourselves with. Worth saying plainly. Everything below that is a number came from a named study read at source with its sample size and date given, or from arithmetic we show in full so you can check it. Competitors are named but never linked.
What is a compounding organic growth engine?
A compounding organic growth engine is a system in which each quarter’s work makes the next quarter’s work cheaper or more effective, so output rises faster than input. Most organic programmes are not one. They are replacement systems, where this quarter’s output covers last quarter’s losses.
The distinction is testable. Ask one question of your own data. Over the last eight quarters, did the number of pages earning meaningful traffic grow faster than your publishing rate? If yes, something is compounding. If it grew at roughly your publishing rate, nothing is compounding and you are paying for a treadmill.
Three things separate the two.
- An accumulating asset. Something that gets more valuable as it gets bigger. Entity strength, earned citations and internal link equity all qualify. A page does not, on its own.
- A loop. Some mechanism by which existing assets make new ones easier to create or rank. Authority is the obvious one.
- A decay rate low enough that the loop outruns it. This is the part nobody models, and it is the part that decides the outcome.
The third one is the whole article. Everything in organic decays, and compounding is simply the condition where accumulation beats decay. Organic does not do that automatically. It does it when you build for it.
Why most organic programmes are not compounding in 2026
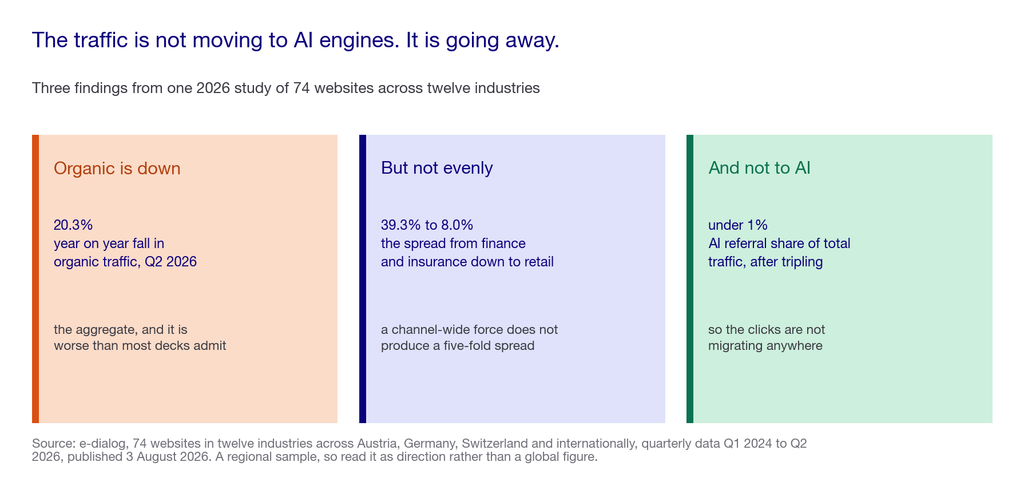
Start with the number, because it is worse than most decks admit. An analysis of 74 websites across twelve industries in Austria, Germany, Switzerland and internationally, covering quarterly data from Q1 2024 to Q2 2026, found organic traffic down 20.3% year on year in the second quarter of 2026.
Two details in that study matter more than the headline.
The decline is wildly uneven. Finance and insurance fell 39.3%. Education fell over 30%. Tourism fell just under 20%. Retail fell 8.0%. A single channel-wide force does not produce a five-fold spread across industries. Something category-specific is doing most of the work, which means something category-specific can be done about it.
The traffic is not going to AI engines. In the same dataset, AI referral traffic tripled over the period and still accounts for less than one percent of total traffic. So the common consolation, that the clicks moved somewhere you are not yet measuring, does not hold. They are not moving. They are going away.
That is the environment. In it, a programme that merely replaces its losses will shrink, because the losses got bigger. Compounding stopped being a nice property and became the only way to stay level.
Where this falls short: 74 sites is a real sample but a regional one, weighted to German-speaking Europe, and one study is not a census. Read it as a strong signal about direction rather than a precise global figure, and run the same calculation on your own Search Console data before you act on it.
If you want to see which of your own pages are decaying and which are accumulating, book a growth audit and we will run the arithmetic with you.
The stat everyone repeats, and what the study actually says
You have seen the headline. AI Overviews cut organic clickthrough by 61%. It is quoted in almost every deck about this subject, including some of ours.
Go to the underlying analysis and the picture changes.
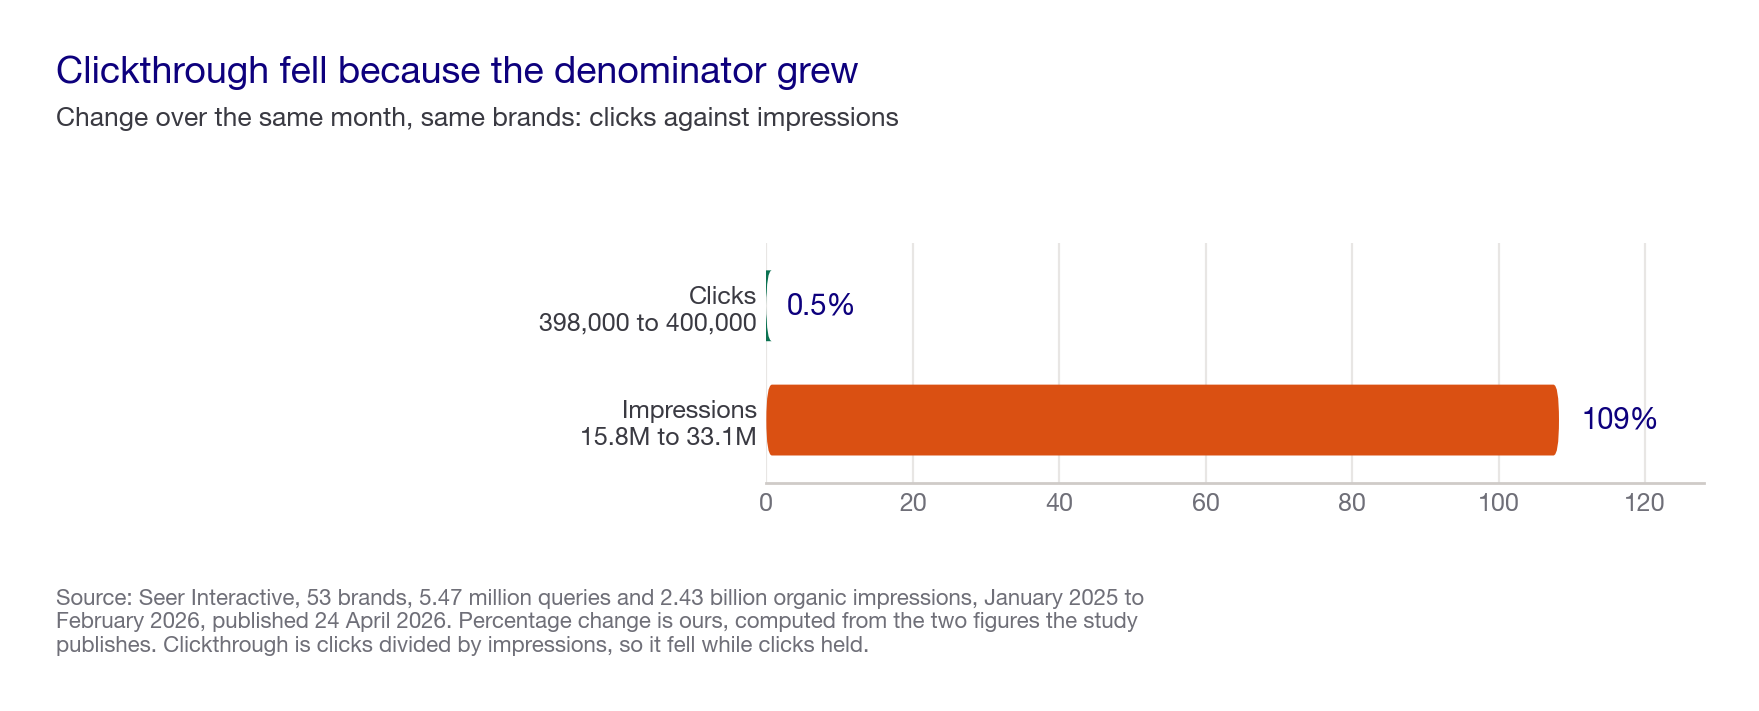
The study covers 53 brands, 5.47 million queries and 2.43 billion organic impressions from January 2025 to February 2026, and it is careful about what it found. In the month the effect was sharpest, clicks were essentially flat, moving from 398,000 to 400,000. Impressions more than doubled, from 15.8 million to 33.1 million. Clickthrough compressed because the denominator grew far faster than the numerator.
Read that again, because it inverts the conclusion most people draw. The clicks did not disappear. You started appearing in far more places without being clicked more often.
Two further findings from the same analysis are almost never quoted. Organic clickthrough on queries with AI Overviews recovered from 1.31% in December 2025 to 2.36% in February 2026, a rise of roughly 80% in three months. And paid clickthrough on those same queries held between 13.99% and 17.95% across the whole year with no meaningful decline. If AI Overviews were destroying the click, paid would have moved too. It did not.
So what is the honest reading? Your impressions are inflating faster than your clicks, which means your clickthrough will keep falling even when nothing about your performance has changed. Report clickthrough as your headline organic metric in 2026 and you will report a decline you did not cause and cannot fix.
Where this falls short: this is one analysis of 53 brands, weighted toward the kinds of companies that buy enterprise search tooling, and a single month’s clicks-versus-impressions comparison is the sharpest illustration rather than the whole dataset. We quote it because the authors published the underlying numbers, which most of the people citing their headline did not read.
Three more things the category believes that the data does not support
“Organic compounds from month four.” Several published organic growth guides say results turn exponential after roughly six months. The arithmetic below says otherwise. At a 10% quarterly decay rate, a programme reaches about 63% of its eventual ceiling in ten quarters, which is two and a half years. Month four is when the first pages start working, not when compounding begins.
“Organic is declining as a channel.” The 2026 spread runs from minus 39.3% to minus 8.0% depending on industry. That is not a channel in decline. That is a channel where the outcome now depends far more on what you do than it used to.
“More content is the answer.” More content raises your ceiling in a straight line. So does cutting your decay rate, and the second one works on pages you have already paid for. We get to the crossover point below.
“You need a separate AI content strategy.” Google’s own guidance on optimising for generative AI features states that optimising for generative AI search is still SEO, running on core ranking systems with no separate index. Treat it as one programme. Then hold the other half of that, which is that Google describes Google, and no other engine publishes equivalent documentation.
The mechanism: what compounds, and what only accumulates
This is the distinction that makes the arithmetic work, so it is worth being precise.
Things that only accumulate. Published pages. Keywords ranked. Words shipped. These grow when you add to them and shrink when you stop. They are inventory, and inventory has carrying costs.
Things that compound. Entity strength, which makes every subsequent page easier to rank. Earned citations from sources engines already trust, which transfer across engines rather than sitting on one. Internal link equity, which routes accumulated authority toward whatever you publish next. Audience, which produces demand that does not depend on a ranking at all.
The test is simple. If the asset makes the next unit of work cheaper, it compounds. If it only adds to a total, it accumulates.
Most organic budgets buy accumulation and hope for compounding. That is the central mistake, and it is expensive rather than stupid, because accumulation is easy to buy and easy to report.
Our visibility, citability and retrievability framework sets out the three levers underneath this in more detail.
The arithmetic: your library has a ceiling
Here is the model. It is deliberately simple, and you can run it in a spreadsheet in five minutes.
Let P be the number of pages you publish per quarter that earn meaningful traffic. Let d be the fraction of your working library that stops earning meaningful traffic each quarter. Then next quarter’s library is this quarter’s library, minus decay, plus new work.
L(next) = L(now) x (1 – d) + P
Run that forward and it converges. The ceiling is:
L* = P / d
That single expression is the most useful thing in this article.
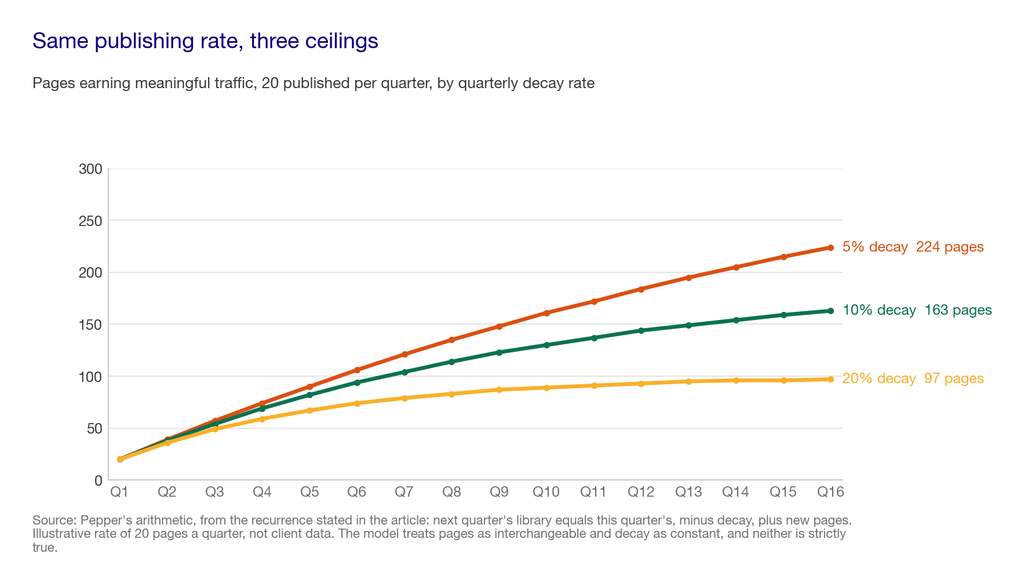
Take a team publishing 20 pages a quarter.
| Quarterly decay rate | Library ceiling | Where it stands after 4 years |
|---|---|---|
| 5% | 400 pages | 224 pages and still climbing |
| 10% | 200 pages | 163 pages, nearly flat |
| 20% | 100 pages | 97 pages, flat since year three |
Three teams, identical output, identical budget, and after four years one has more than twice the working library of another. Nobody in that picture worked harder. They just had different decay rates, and only one of them was measuring it.
Three things follow, and the third is the one that changes budgets.
- Doubling output doubles the ceiling. Linear, predictable, and it costs twice the content budget every quarter forever.
- Halving decay also doubles the ceiling. Identical effect on the number. It costs a refresh programme run against pages you have already paid for once.
- So there is a crossover, and you can calculate yours. Compare the cost of producing P more pages a quarter against the cost of refreshing enough of your library to halve d. For most teams past a few hundred pages, the refresh is cheaper, and almost nobody funds it.
Where this falls short, and it costs us something to admit: this model treats pages as interchangeable and decay as a constant, and neither is true. One pillar page can outweigh fifty others, and decay is lumpy, arriving with algorithm updates rather than smoothly. The model will not predict your traffic. What it will do is tell you which lever is worth pulling, and it is right about that even when the numbers are rough.
How we weight the four levers
Four levers, weighted before we looked at any account. These are our priorities, not measured coefficients.
| Lever | Weight | Why it sits here |
|---|---|---|
| Decay control | 35 | The arithmetic says it moves the ceiling as hard as output does, at lower cost, and it is the lever almost nobody funds |
| Authority that transfers | 25 | Earned citations and entity strength survive an engine changing its mind, which is the only durable asset in the system |
| Technical floor | 20 | Necessary and not sufficient. Nothing accrues if engines cannot retrieve you, but fixing it alone produces no growth |
| Publishing rate | 20 | Deliberately last, because it is what every team funds first and it only moves the ceiling in a straight line |
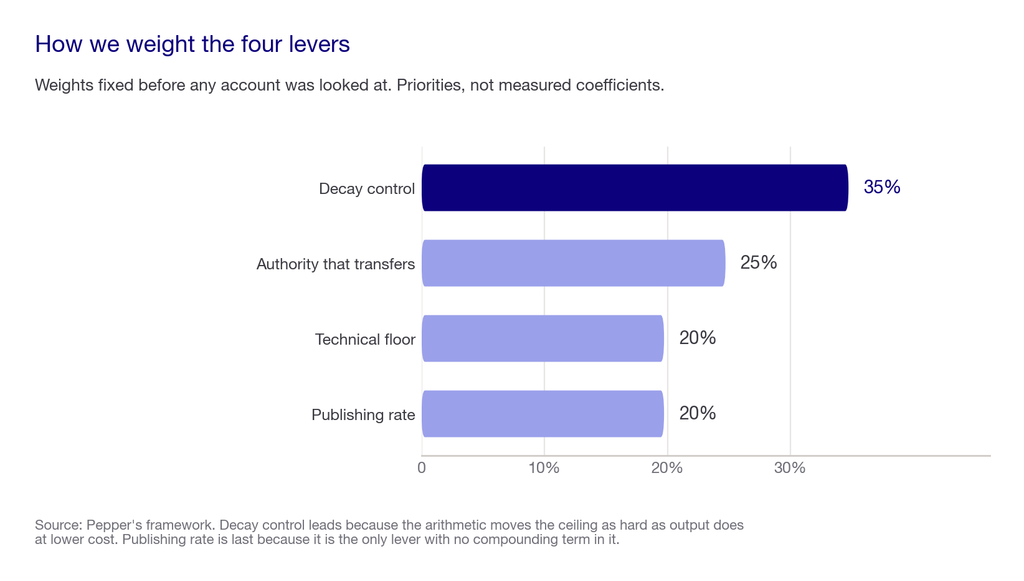
Why publishing rate comes last. It is the only lever whose cost recurs in full every quarter, and it is the only one with no compounding term in it. A page you publish does not make the next page easier. Authority does.
Where this falls short: a team with almost no library has nothing to refresh, so publishing genuinely is their first lever. These weights describe a programme with an existing back catalogue, which is most teams reading this and not all of them.
The four levers in practice
1. Decay control
- What it is. A funded, scheduled programme of refreshing, consolidating and retiring pages, sized against your measured decay rate rather than against a content calendar.
- How to measure it. Take the pages that earned meaningful traffic four quarters ago. Count how many still do. That fraction, subtracted from one, is your annual decay. Divide by four for a rough quarterly figure.
- What good looks like. A decay rate you can state from memory, a refresh budget expressed as a percentage of the content budget, and an owner.
- The common failure. Refresh treated as a tidy-up job that happens when the publishing pipeline has a gap. It never has a gap.
- Where it falls short. Refreshing a page that was never going to work is waste, and some decay is correct: a page about a product you retired should decay. Consolidation and deletion belong in this lever alongside refreshing.
2. Authority that transfers
- What it is. Earned citations, brand mentions and entity strength on sources that engines already trust, rather than on your own domain.
- How to measure it. Brand Visibility across a fixed prompt set, tracked on more than one engine, with the sources behind each mention recorded.
- What good looks like. Your brand appears in answers where your domain is not the cited source. That is authority working independently of your pages, which is exactly the property that survives an engine change.
- The common failure. Buying placements. Paid coverage does not create consensus, and consensus is what a model reads.
- Where it falls short. It is the slowest lever in the set, it cannot be bought honestly, and it is the hardest to attribute. Our note on how to measure AI search honestly covers the sampling problem underneath it.
3. Technical floor
- What it is. Crawlability, rendering, indexation and AI crawler access. The conditions under which anything you build can be retrieved at all.
- How to measure it. Server logs first, Search Console second, a crawler third.
- What good looks like. The templates carrying your revenue are crawled at a frequency you can state, render without JavaScript dependencies, and are reachable by the crawlers you have decided to allow.
- The common failure. Treating a crawler export as a diagnosis. It tells you what a crawler found, not what an engine did.
- Where it falls short. This lever caps your outcome and never creates one. A technically flawless site in a category with no demand still produces nothing. Full depth in our enterprise audit framework and its 47 technical checks.
4. Publishing rate
- What it is. New pages per quarter that earn meaningful traffic. Note the qualifier, because pages that never earn anything do not enter the model.
- How to measure it. Count pages published four quarters ago that earn traffic now. That is your real P, and it is usually well below the number in the content plan.
- What good looks like. A gap between pages published and pages working that you can state and are trying to close.
- The common failure. Reporting volume as the metric. Volume is an input, and treating an input as an outcome is how a treadmill gets funded for three years.
- Where it falls short. It is the easiest lever to move and the least valuable per unit of spend, which is precisely why it absorbs most budgets. Our work on pillar content strategy covers how to make the pages you do publish carry more.
The compounding engine at a glance
| Lever | Weight | What it moves | How to measure it | What it costs |
|---|---|---|---|---|
| Decay control | 35 | The ceiling, hyperbolically | Share of pages still earning after four quarters | A refresh programme against pages you already own. Usually 15% to 25% of the content budget |
| Authority that transfers | 25 | The rate at which everything else works | Brand Visibility across a fixed prompt set | Digital PR and earned media. The slowest and least predictable line |
| Technical floor | 20 | Whether anything accrues at all | Log evidence, then Search Console | Mostly engineering days rather than software. Free to about $200 a month for a crawler |
| Publishing rate | 20 | The ceiling, linearly | Pages published four quarters ago still earning now | The largest recurring line in most organic budgets |
| All four, internally | 100 | The engine | Your own data, quarterly | A funded team and a quarterly rhythm |
| All four, with a partner | 100 | The engine, faster | The partner brings the measurement | Rarely published. Enterprise organic retainers typically start in the low five figures a month |
What it costs to build
- The measurement costs almost nothing. Decay rate, real publishing rate and the crossover calculation all come out of Search Console and a spreadsheet in an afternoon.
- The refresh programme is the real line item. Budget it as a percentage of content spend rather than as a project, because a project ends and decay does not.
- Earned authority is the least predictable spend and the one most likely to be cut first in a flat quarter, which is exactly the wrong decision given it is the slowest to rebuild.
- Enterprise platforms that supply the evidence start around $2,500 a month, covered in our enterprise pricing work, and our breakdown of what agency services include covers buying the execution.
- The cheapest thing you can do this quarter is stop paying for accumulation you are not measuring. Count the pages published a year ago that earn nothing today. That number is usually the budget for the refresh programme.
How Pepper fits
Pepper is an agentic organic growth engine and an organic growth partner, and the four levers above are what our growth teams are actually managing.
- Agent Atlas makes the repeatable levers into agents your team owns. Decay monitoring, refresh triage and prompt set maintenance are workflows rather than heroics. System agents stay fixed, user agents stay editable and versioned, and customers log in and build and run their own inside Atlas.
- Pepper’s GEO platform measures the authority lever. Brand Visibility for how often engines mention you, Domain Prompt Presence for how often they cite a page from your domain, and Share of Voice for your slice of the category. The gap between the first two tells you whether your authority is transferring or trapped on your own pages. See the platform.
- A growth team works alongside yours, which matters most on decay control, because refresh is the work that gets dropped when an internal team is busy.
- Proof rather than adjectives. Acceldata went from 85 to more than 300 top three keywords with 6X organic traffic growth. More in our case studies, and the B2B SaaS practice is where most of this model was built.
Where Pepper fits, and where it does not. We are built for programmes with an existing library and a quarterly rhythm, because that is where decay control pays. A company publishing its first fifty pages has no decay problem yet and should spend on production. We also publish no pricing, so budget discovery is a conversation rather than a page.
How to choose who builds this with you
I would start by asking a prospective partner for a number rather than a plan, because the number tells you whether they have ever modelled this.
The framing judgement first, anchored outside my own view. Google’s guidance says optimising for generative AI search is still SEO, on core ranking systems, with no separate AI index. It also advises against any provider guaranteeing rankings, because no external party has access to those systems. Read the first half as permission to stop buying a separate AI programme. Then hold the second half, which is that Google documents Google, and your own logs are the only cross engine evidence you have.
The Pepper view on top of that is narrower. Anyone can produce a content plan. Very few can tell you your decay rate, and nobody who cannot should be setting your publishing budget.
Here is the 100 point scorecard I would run over any organic partner, including us.
| Area | Weight | What a strong partner demonstrates |
|---|---|---|
| Can state your decay rate | 30 | They compute it from your own Search Console data in the first two weeks and show the working, rather than quoting an industry average |
| Refresh is funded, not implied | 25 | A named percentage of the programme goes to existing pages, with an owner, and it survives a quarter when the publishing plan slips |
| Authority work is earned | 20 | Their plan for citations involves people and evidence rather than placements, and they will say plainly what they will not buy |
| Measurement separates input from outcome | 15 | They report pages that work rather than pages shipped, and they will tell you when a rising impression count is making your clickthrough look worse |
| They will name what to stop | 10 | The plan includes pages to consolidate or retire, and they are willing to argue for a smaller library |
Then run the live test, on us as readily as on anyone else. Give any prospective partner 25 buying questions from your own category plus read access to four quarters of Search Console, and hold their answer for 90 days before you judge it. Rankings and engines both move, so a single reading proves nothing. Ask them things with numbers in the answer. For example: “what share of pages published a year ago still earn traffic”, “what is our quarterly decay rate”, “at our costs, is it cheaper to publish twenty more pages or to halve decay”, “which fifty pages would you consolidate”.
Ask them to come back with five things. Your decay rate. Your real publishing rate, meaning pages that work rather than pages shipped. The crossover point between production and refresh at your costs. The pages they would retire. And what they would measure in ninety days to prove any of it.
A partner who answers with your own numbers beats one who answers with a content calendar. And one who cannot compute a decay rate is selling you inventory.
The weaker way to run this, and it is the common one. Set a publishing target. Hire to hit it. Report pages shipped and keywords ranked. Watch traffic stay flat while output rises. Conclude that you need more content. Increase the target.
The stronger sequence. Measure decay before setting any target. Compute the ceiling your current numbers imply. Compare the cost of raising output against the cost of cutting decay. Fund the cheaper one first. Report pages that work rather than pages shipped, and report impressions alongside clickthrough so a growing denominator does not read as a failure. The distinction matters because the first sequence can run for years without anybody noticing the ceiling, and the second one finds it in an afternoon.
Red flags, each one something a provider actually says.
- A guarantee of rankings, citations or traffic, which Google itself advises against.
- A content volume target set before any decay measurement. The target is unfalsifiable, which is why it is popular.
- “Organic compounds, you just need to be patient.” Compounding is a condition, not a promise, and it has an arithmetic test.
- Refresh described as included without a named percentage, an owner or a schedule. It is not included.
- Clickthrough reported as the headline metric in 2026, with no impression context. Your denominator is growing whether or not your performance changed.
- A single composite score for organic health, with no published method.
- Paid placements sold as authority building. It creates a placement, not a consensus.
Five questions worth asking, and what a good answer sounds like.
- “What is our decay rate?” A good answer is a number with the method attached and an admission of the error bars. A bad answer is an industry benchmark.
- “At our costs, which is cheaper, more pages or less decay?” A good answer does the division in front of you. A bad answer says both matter.
- “How much of the budget goes to pages we already own?” A good answer is a percentage with an owner. A bad answer is that refresh is built in.
- “How will you build authority we keep if an engine changes?” A good answer talks about earned citations and entity strength. A bad answer talks about placements.
- “What will you tell us to stop doing?” A good answer names something in the first month. A bad answer adds to the plan and removes nothing.
If I reduce this to one principle: measure the decay before you set the target. Every other decision in an organic programme is downstream of that number, and most teams have never calculated it.
The honest note that costs us something. Very few partners are genuinely strong across production, technical work, earned media and analytics at once, and we would not claim uniform strength across all four either. Find out which of the four your candidate is weakest at, because that is the one that will cap the engine.
What nobody should promise you
Nobody should promise that organic compounds. It compounds under conditions, and those conditions are measurable, so a provider who will not measure them is asking you to take a property of your programme on faith.
Nobody should promise a ranking or a citation for a fee. Google advises against providers who guarantee rankings, because no external party has access to the ranking systems.
Nobody should set a publishing target before measuring decay. The target will be met and the traffic will not move, and both of those things will be true at once for years.
Nobody should report clickthrough in 2026 without reporting impressions beside it. One study of 53 brands found clicks flat while impressions doubled. A metric that falls when nothing has changed is not a metric, it is a trap.
Where this stops working, including for us
If your library is under about fifty working pages, you do not need this framework yet and you should not buy a refresh programme. You have no decay problem to solve. Spend on production and come back in a year.
If your category has no measurable search or prompt demand, none of these levers will produce anything. That finding is worth more than any plan, and it costs nothing to establish.
If you cannot get four quarters of Search Console history, say so in the model rather than substituting an industry decay benchmark. A stated gap beats a confident guess.
Where Pepper fits and does not. This model assumes an existing back catalogue and a quarterly rhythm, which is what we are built for. Early stage production at volume is a different product, and specialist content shops do it well.
Where to go next
Calculate two numbers this week. The share of pages published four quarters ago that still earn traffic, and the number of pages you publish per quarter that ever earn any. Divide the second by one minus the first, and you have your ceiling.
Then decide which lever is cheaper at your costs. For the adjacent decisions, our 47 check enterprise audit framework covers the technical floor, what actually matters in AI search measurement covers the authority lever, the differences between AEO, SEO and GEO settles the terminology question, and the visibility strategy that still works covers what to do about falling clicks. To see where you stand today, see where you show up.
Frequently asked questions
What is an organic growth engine?
A system where each quarter’s work makes the next quarter’s cheaper or more effective, so output rises faster than input. It requires an accumulating asset, a loop that turns that asset into easier future wins, and a decay rate low enough for the loop to outrun it.
How do you know if your organic growth is compounding?
Compare eight quarters of data. If the number of pages earning meaningful traffic grew faster than your publishing rate, something is compounding. If it grew at roughly your publishing rate, you are replacing losses rather than building.
What is content decay and how do you measure it?
Content decay is the share of your working library that stops earning meaningful traffic each period. Measure it by counting pages that earned traffic four quarters ago and still do. Subtract that fraction from one for your annual rate.
Is organic traffic declining in 2026?
In aggregate, yes. One study of 74 sites found organic down 20.3% year on year in Q2 2026. The spread runs from minus 39.3% in finance and insurance to minus 8.0% in retail, so the outcome depends heavily on category and execution.
Did AI Overviews really cut clickthrough by 61%?
Clickthrough fell, but the underlying study shows clicks essentially flat at about 400,000 while impressions more than doubled. The ratio compressed because the denominator grew. Clickthrough on those queries has since recovered by roughly 80% in three months.
Should we publish more content or refresh what we have?
Calculate both. Doubling output doubles your library ceiling, and so does halving your decay rate. Refresh works on pages you have already paid for, so for most teams past a few hundred pages it is the cheaper of the two.
How long does organic take to compound?
Longer than most guides claim. At a 10% quarterly decay rate a programme reaches about 63% of its ceiling in ten quarters, which is two and a half years. Pages start working within months, but compounding is a multi-year condition.
Do we need a separate AI content strategy?
Google states that optimising for generative AI search is still SEO, on the same ranking systems with no separate index. Run one programme. Remember that Google documents only Google, so your own server logs remain the only cross-engine evidence you have.
Sources and further reading
- e-dialog, organic traffic study of the DACH region, published 3 August 2026. Method: 74 websites across twelve industries in Austria, Germany, Switzerland and internationally, quarterly data from Q1 2024 to Q2 2026. Source of the 20.3% year on year decline in Q2 2026, the industry spread from minus 39.3% in finance and insurance to minus 8.0% in retail, and the finding that AI referral traffic tripled while remaining under 1% of total traffic. Limitations: a regional sample weighted to German-speaking Europe, so read it as direction rather than a global figure.
- Seer Interactive, the impact of AI Overviews on Google clickthrough, 2026 update, published 24 April 2026. Method: 53 brands, 5.47 million queries, 2.43 billion organic impressions and 296.9 million paid impressions, January 2025 to February 2026. Source of the clicks-versus-impressions figures (398,000 to 400,000 clicks against 15.8 million to 33.1 million impressions), the recovery in AI Overview clickthrough from 1.31% to 2.36%, and the stability of paid clickthrough between 13.99% and 17.95%. Limitations: 53 brands weighted toward companies buying enterprise search tooling.
- Google Search Central, guide to optimizing for generative AI features, page last updated 10 July 2026. Source of the position that optimising for generative AI search is still SEO, and of the advice against providers guaranteeing rankings. Applies to Google Search only.
- Google Search Central, managing crawl budget for large sites. Documentation rather than research, current until Google changes it. Referenced for the technical floor lever.
- Pepper, the visibility, citability and retrievability framework. The three levers underneath the compounding assets described here, and the source of the distinction between authority that transfers and authority trapped on your own domain.
- The library ceiling model and all figures derived from it are our own arithmetic. The recurrence is stated in full in the body so you can check it, and the worked figures use an illustrative publishing rate of 20 pages a quarter rather than any client’s data. Limitations are given in the same section: the model treats pages as interchangeable and decay as constant, and neither is true.
What is not here, and why. No industry benchmark decay rate, because the spread across industries in the one 2026 study we trust runs five to one, and a single average would be worse than useless. No prediction of your traffic, because the model deliberately answers which lever to pull rather than what you will get. No 2025 statistics, including several widely quoted ones, because engine behaviour has moved enough that they describe a different system. The widely repeated 61% clickthrough figure is included only to correct it, with the publisher’s own underlying numbers given.
Latest Blogs
AI search optimization has four cost layers and only one of them has a price you can look up. Software is published, comparable and the cheapest. Agency retainers are published by exactly two firms. Earned media, which drives most AI citations, is priced by almost nobody. And the fourth layer, doing it with your own people, turns out to have no market rate at all. A study of 3,900 SEO job listings found that just 6.3% of senior roles mention AI search, and published salary figures for the same job title differ by 76% between sources.
We re-read every published GEO agency price on 25 September 2026, fifteen days after our own benchmark first recorded them. All four held, which is worth knowing on its own because the software side of this market has been withdrawing prices all quarter. The more useful finding came from the one agency that publishes volumes alongside price. Ten blog articles at $3,000 a month and forty at $8,000 works out at $300 and $200 an article. That is a content production contract with a GEO label, and the citation evidence says content you own accounts for a small minority of AI citations.
Our own benchmark of 30 published prices already answers what GEO costs. This answers the different question, which is what you should budget and where it should go. Two numbers decide it. A study of more than 25 million cited links found earned media drives 84% of AI citations while paid and advertorial content drives 0.3%. And the Gartner CMO survey of 401 CMOs puts marketing at 7.8% of revenue with SEO the largest single line inside owned and earned digital. Put those together and the answer is that GEO is not a new budget line at all. It is a reallocation, and most teams are making it in the wrong direction.
Get your hands on the latest news!