GEO budget 2026: how much to spend, and where to put it
The short answer
Do not open a new line. Size GEO from the organic budget you already run, then split it against where citations actually come from. Earned media drives 84% of AI citations and paid drives 0.3%. A budget weighted toward on-page production is aimed at the smaller half of the problem. Fund earned authority first, the owned foundation second, measurement third. Then hold it for four quarters before judging it.
Key takeaways
- This is not the cost question. Our benchmark of 30 published GEO prices answers what the market charges. This answers what you should budget and how to split it.
- The allocation evidence is unusually good. A study of more than 25 million cited links across ChatGPT, Claude and Gemini, covering 17 industries, found earned media drives 84% of AI citations.
- Paid content drives 0.3%. Any part of a GEO budget spent on placement is buying three tenths of one percent of the citation surface.
- It is stable, which makes it plannable. Across three editions since July 2025, earned media has held between 82% and 89%, and journalism alone between 25% and 27%.
- Size it top down. The Gartner CMO Spend Survey of 401 CMOs puts marketing at 7.8% of revenue. SEO is the largest single line inside owned and earned digital, at 9.4% of mean budget.
- Budget for four quarters, not one. Citation to pipeline runs three to five quarters, so a budget reviewed at quarter two gets cancelled before it can report.
- Pepper is an agentic organic growth engine and an organic growth partner. Agent Atlas puts the agents in your team’s hands. Pepper’s GEO platform reports Brand Visibility, Domain Prompt Presence and Share of Voice. A growth team works alongside yours. Eight years, more than 250 enterprises, more than 10 million tracked prompts.
A note on where this comes from. I spend my time on why some content gets cited and most does not. The honest answer is rarely about the content. It is about who else has written about you. Pepper runs organic for more than 250 enterprises over eight years and tracks more than 10 million prompts across every major engine. The budgets we inherit are almost always weighted toward what is easiest to buy rather than what earns the citation.
Disclosure: Pepper sells GEO services, so we benefit from you having a GEO budget. The article argues you should mostly not create one, and should reallocate an existing budget instead. Every figure is traced to a named study with its sample size. Competitors are named but never linked.
What is a GEO budget, and should it be a separate line?
A GEO budget is the money allocated to getting your brand named and cited inside generated answers. In most organisations it should not be a new line at all. It should be a reallocation inside the organic budget you already run.
Our own live position predates the argument below and is worth quoting. Our page on the differences between AEO, SEO and GEO concludes that the real cost shift is reallocating budget toward earned media rather than adding separate programmes. The citation evidence in the next section is why.
Three practical consequences follow.
- A new line invites a new review cycle, usually quarterly, on work whose effects land three to five quarters out. That mismatch kills more GEO programmes than bad execution does.
- A reallocation forces the harder conversation about what you stop doing, which is the conversation that actually improves the result.
- A separate team follows a separate line, and a separate GEO team duplicates the technical and content work your organic team already does.
Where AI citations actually come from
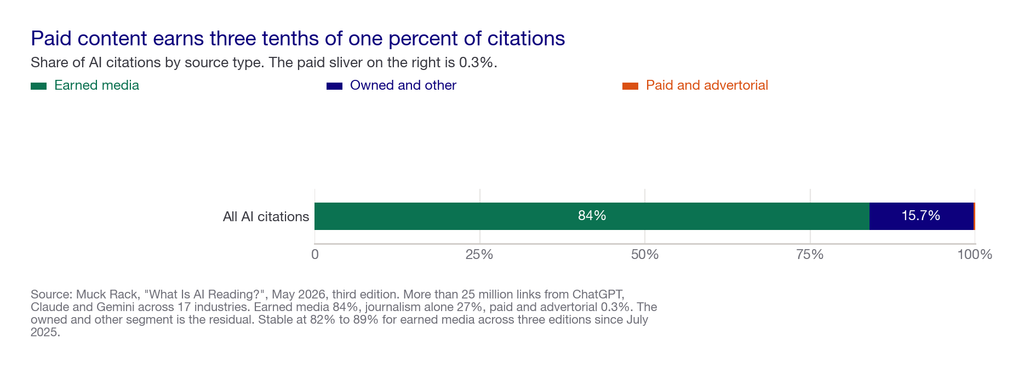
The best allocation evidence available is Muck Rack’s “What Is AI Reading?”, third edition, published May 2026. It analysed more than 25 million links from ChatGPT, Claude and Gemini responses across 17 industries.
- Earned media accounts for 84% of all AI citations. The category covers journalism, academic research, government sources, encyclopedic sites and third-party corporate content.
- Journalism alone makes up 27% of cited sources.
- Paid and advertorial content accounts for 0.3%.
The stability is what makes this budgetable. Across all three editions going back to July 2025, earned media has ranged between 82% and 89%, and journalism between 25% and 27%. A number that holds within a few points across three measurements and a year is a number you can plan against. That is rare in this category.
Now put the 0.3% next to a typical GEO proposal. Most of what is sold as GEO is on-page work. Rewriting pages, adding schema, building FAQ blocks, producing more articles. That work is necessary, and it is aimed at the minority of the citation surface. The majority is decided by what other people have published about you.
Where it falls short: this measures which sources engines cite, not which sources cause a purchase. A citation from an encyclopedic site and one from a trade publication your buyers read count identically. It also measures the whole web rather than your category, and a narrow B2B niche may differ.
If you want to see which sources are winning citations in your category before you set a budget, book a growth audit and we will map your citation core with you.
How much to budget, top down
You cannot benchmark a GEO budget bottom up, because nobody publishes a defensible GEO-specific percentage. So size it from something you can verify.
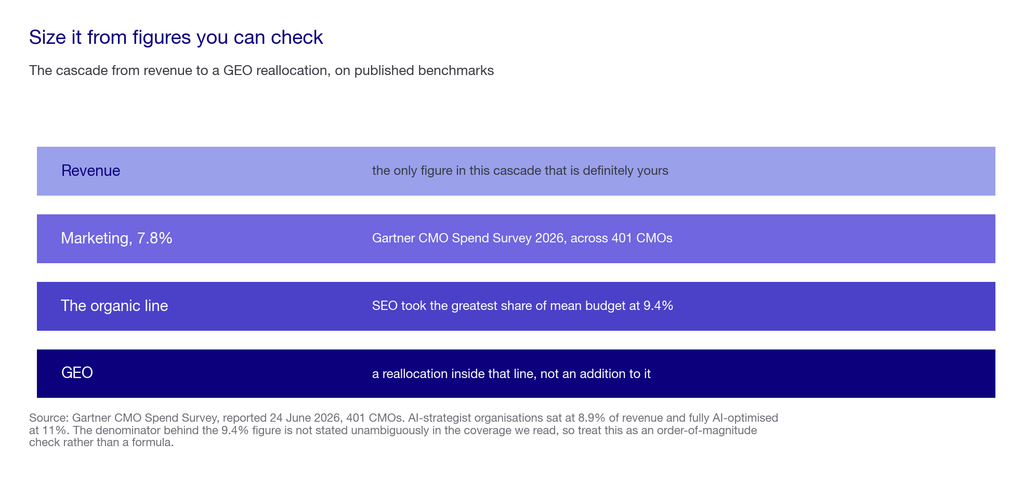
The Gartner CMO Spend Survey, published 24 June 2026 and based on 401 CMOs, gives two usable anchors.
- Marketing budgets sit at 7.8% of total revenue across all respondents. Organisations describing themselves as AI strategists sit at 8.9%, and those with fully optimised AI at 11%.
- SEO took the greatest share of mean budget at 9.4% among owned and earned digital media channels, up from 8.9% the previous year.
A worked example, with illustrative inputs rather than client data. Take a company at $50 million revenue. Budgeting at the 7.8% benchmark gives roughly $3.9 million in marketing. Apply the published SEO share and the organic line lands near $370,000 a year. GEO is a reallocation inside that figure, not an addition to it.
Where it falls short, and it matters: the 9.4% figure is published as the greatest share of mean budget among owned and earned digital channels. The denominator is not stated unambiguously in the coverage we read. So treat the cascade as an order-of-magnitude check, not a formula. If your organic line sits wildly outside it, investigate. If it is close, the benchmark has told you nothing.
How we weight the allocation
Four destinations, weighted before we looked at any account. These are our priorities, not measured coefficients.
| Destination | Weight | Why it sits here |
|---|---|---|
| Earned authority work | 40 | Digital PR, original research and expert contribution, because 84% of citations come from sources you do not own |
| Owned foundation and retrievability | 30 | Engines cannot cite a page they cannot reach or parse, so this caps everything above it without producing anything on its own |
| Measurement and prompt discipline | 20 | The lag is three to five quarters, and without a frozen prompt set and a baseline you will cancel before the signal arrives |
| Refresh of the existing library | 10 | Cheaper per unit of effect than new production, and it protects citations you have already earned |
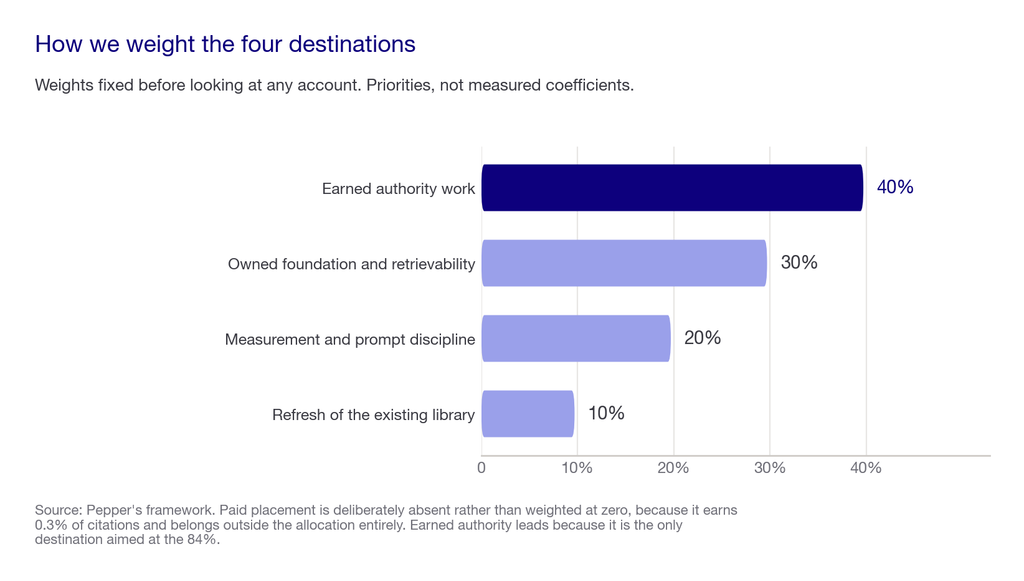
Paid placement gets zero, and that is deliberate. At 0.3% of citations it is the worst-performing destination in the set by an order of magnitude. If someone proposes paid placement as part of a GEO budget, ask them which number they are working from.
Why earned authority leads. It is the only destination aimed at the 84%. It is also the slowest and least controllable. That is exactly why it loses budget arguments to production work, which can be scheduled and counted.
Where it falls short: these weights assume a functioning organic programme already exists. A company with no publishing capability cannot start with digital PR, because there is nothing for a journalist to link to. Fund the owned foundation first in that case, and invert the top two.
What to fund, by year
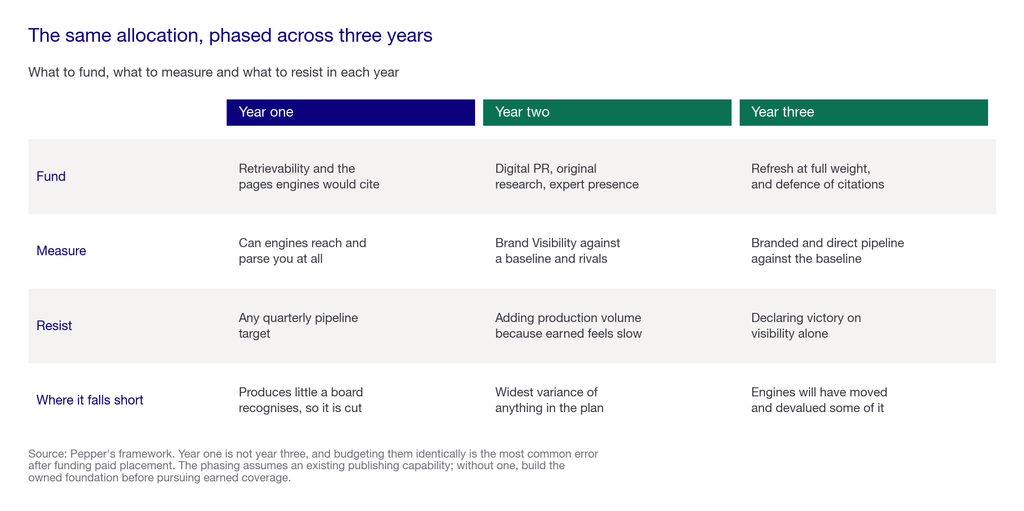
Year one is not year three, and budgeting them identically is the most common error after the paid placement one.
Year one: foundation and baseline
- Fund: retrievability fixes, the pages engines would cite if they could reach them, a frozen prompt set, and the measurement baseline.
- Measure: whether engines can reach and parse you, and where you stand at the comparison stage. Not pipeline.
- Resist: any proposal to buy citations, and any quarterly pipeline target.
- Where it falls short: year one produces almost nothing a board recognises as a result, which makes it the hardest year to fund and the easiest to cut.
Year two: earned authority at scale
- Fund: digital PR, original research worth citing, expert contribution to the publications your buyers read, and the refresh programme.
- Measure: Brand Visibility and Domain Prompt Presence against a baseline, plus movement against named competitors.
- Resist: the temptation to add production volume because earned work feels slow.
- Where it falls short: earned authority has the widest variance of anything in the plan. A single piece of original research can outperform a year of steady output. You cannot schedule that.
Year three: compounding and defence
- Fund: the refresh programme at full weight, defence of the citations you hold, and expansion into adjacent prompt sets.
- Measure: whether branded and direct pipeline is diverging from your baseline, which is the first point at which that read is meaningful.
- Resist: declaring victory on visibility metrics alone.
- Where it falls short: by year three the engines will have changed, and some of what you built will have been devalued by a model update you did not control.
GEO budget at a glance
| Destination | Share | What it buys | How to tell it is working | Typical cost |
|---|---|---|---|---|
| Earned authority | 40% | Coverage, research citations and expert presence on third-party sources | Your brand appears in answers where your own domain is not the cited source | The largest line. Digital PR retainers and research production |
| Owned foundation | 30% | Pages engines can reach, parse and lift | Crawl and render evidence from your own logs, not a tool’s simulation | Engineering days, plus a crawler licence from about $200 a month |
| Measurement | 20% | A frozen prompt set, a baseline and a defensible threshold | You can say what moved and whether it cleared your noise | Prompt tracking from about $29 a month at entry tiers |
| Library refresh | 10% | Protection of citations you already earned | Older pages hold or grow rather than decaying out | Existing content team time, reallocated |
| Paid placement | 0% | 0.3% of the citation surface | It does not | Whatever you are quoted, which is too much |
| New GEO budget line | Avoid | A separate review cycle on a three to five quarter lag | It does not | The programme, cancelled at quarter two |
What this actually costs to run
- The measurement layer is nearly free. A frozen prompt set, two first-party reports from Google and Bing, and a form field. Prompt tracking starts around $29 a month at published entry tiers.
- Earned authority is the expensive line and the one without a price list. Our survey of what agencies publish for GEO found retainers starting around $3,000 a month, and most of the market publishes nothing.
- The owned foundation is mostly engineering days, which is a capacity conversation rather than a cash one, and capacity is usually the binding constraint.
- Enterprise platforms start around $2,500 a month, covered in our enterprise pricing work, and our breakdown of agency services covers buying the execution.
- The cheapest move available is reallocation. Most teams already spend enough. They spend it on the 15% rather than the 84%.
How Pepper fits
Pepper is an agentic organic growth engine and an organic growth partner, and this allocation is what our growth teams argue for rather than a model we published.
- Pepper’s GEO platform tells you whether the earned work is landing. Brand Visibility for how often engines mention you, Domain Prompt Presence for how often they cite a page from your domain, and Share of Voice for your slice of the category. The gap between the first two is the reading that matters here: mentioned often and cited rarely means your authority is earned but your own pages are not part of the answer. See the platform.
- Agent Atlas protects the measurement line from being cut. Prompt set maintenance, refresh triage and baseline re-runs are workflows rather than someone’s spare Friday. System agents stay fixed, user agents stay editable and versioned, and customers log in and build and run their own inside Atlas.
- A growth team works alongside yours on the earned authority line, which is the one internal teams find hardest to staff and the first to be cut.
- Proof rather than adjectives. Acceldata went from 85 to more than 300 top three keywords with 6X organic traffic growth. More in our case studies, and the B2B SaaS practice is where this allocation was settled.
Where Pepper fits, and where it does not. We are built for programmes that can hold a four-quarter budget, because that is the shortest window in which this allocation can report. A team that must show a result inside two quarters should spend on paid demand generation this year and come back to GEO when the planning horizon allows it. We also publish no pricing, so budget discovery is a conversation rather than a page.
How to choose who spends your GEO budget
I would ask one question before any scorecard: what share of this budget goes to sources we do not own? The answer tells you whether the provider has read the citation evidence or is selling you content production with a new name on it.
The framing judgement first, anchored outside my own view. Google’s guidance on optimising for generative AI features states that optimising for generative AI search is still SEO, running on core ranking systems with no separate index, and it advises against providers guaranteeing rankings because no external party has access to those systems. Read that as permission to stop funding a separate AI programme, and as a filter on anyone promising an outcome. Then hold the other half, which is that Google documents Google, while the engines in the citation study above publish nothing comparable.
The Pepper view on top is narrower. The citation evidence has been stable for a year and is publicly available. A provider whose allocation ignores it has either not read it or is selling what they already had.
Here is the 100 point scorecard I would run over any partner, including us.
| Area | Weight | What a strong partner demonstrates |
|---|---|---|
| Majority of spend aimed off your domain | 30 | Earned authority is the largest line in their proposal, and they can name the publications and research formats they will pursue in your category |
| They propose a reallocation, not an addition | 25 | The plan says what to stop funding, and it survives a conversation with whoever owns that existing budget |
| Zero paid placement | 20 | They will not sell you sponsored coverage as a citation strategy, and they can cite the figure that explains why |
| The review cycle matches the lag | 15 | They ask for four quarters before judgement and say so in writing before you sign, rather than promising quarterly proof |
| Measurement is funded, not implied | 10 | A named share of the budget goes to prompt tracking and baselining, with an owner |
Then run the live test, on us as readily as on anyone else. Give any prospective partner 25 buying questions from your own category, ask them to map which sources currently win those answers, and hold the plan for 90 days before judging it. Engines vary between runs, so one reading proves nothing. Ask them to be specific about destinations. For example: “what share of this budget leaves our domain”, “which three publications in our category do engines cite most”, “what would you stop funding to pay for this”, “what does quarter one produce that we can check”.
Ask them to come back with five things. The split between earned, owned and measurement. The named sources they will pursue. What they would defund. The quarter at which they expect a readable signal. And what would make them tell you to stop.
A partner who names what to defund beats one who adds a line, every time. And one proposing paid placement has not read the evidence that has been public for a year.
The weaker way to run this, and it is the common one. Open a GEO line. Fill it with content production, because that is what is easy to scope and count. Review it quarterly. See visibility move a little and pipeline not at all. Cut it at quarter three, one quarter before the earned work would have started compounding.
The stronger sequence. Do not open a line. Establish where citations in your category come from. Reallocate inside the organic budget toward the sources you do not own. Fund measurement from day one so you can tell a signal from noise. Commit for four quarters and say so to the board in advance. The distinction matters. The first sequence spends real money on the smaller half of the problem. The second spends the same money on the larger half.
Red flags, each one something a provider actually says.
- Paid placement described as a citation strategy. It earns 0.3% of citations, and the figure has been public since 2025.
- A new budget line rather than a reallocation, which sets up a separate review cycle the work cannot survive.
- Quarterly pipeline targets on a three to five quarter lag.
- A content volume commitment as the headline deliverable, which is production sold as GEO.
- No named publications or research formats, only a promise of earned coverage in the abstract.
- Measurement offered as an optional add-on, which means it will be the first thing cut.
- A guarantee of citations, which Google itself advises against in the equivalent case.
Five questions worth asking, and what a good answer sounds like.
- “What share of this budget leaves our domain?” A good answer is a number near half. A bad answer is that it is all integrated.
- “Which sources does our category’s answer actually come from?” A good answer names them from a run they did. A bad answer describes a process.
- “What should we stop funding to pay for this?” A good answer names something specific in the first month. A bad answer adds without subtracting.
- “When will we be able to tell whether this worked?” A good answer says four quarters and explains the lag. A bad answer says next quarter.
- “Would you ever recommend paid placement here?” A good answer is no, with the reason. A bad answer is that it depends on the publication.
If I reduce this to one principle: spend where the citations are, not where the invoices are easy to write. Production is easy to scope, easy to count and aimed at the smaller share of the outcome.
The honest note that costs us something. Very few providers are strong at earned media, content execution, technical work and measurement at once, and we would not claim uniform strength across all four either. Earned authority is the line most agencies are weakest at, including plenty who sell GEO. Concentrate your evaluation there.
What nobody should promise you
Nobody should sell paid placement as a route to AI citations. Paid and advertorial content accounts for 0.3% of citations in a study of more than 25 million links, and that finding has been stable for a year.
Nobody should promise a citation for a fee. Google advises against providers who guarantee rankings, because no external party has access to the ranking systems, and the same logic applies here with more force.
Nobody should propose a GEO budget with quarterly pipeline targets. The lag from citation to pipeline runs three to five quarters. The target cannot be met on schedule, so the programme gets cut for the wrong reason.
Nobody should quote you a GEO budget benchmark as a percentage. No defensible one exists, which is why this article sizes from marketing spend and allocates from citation evidence instead.
Where this stops working, including for us
If you have no publishing capability at all, invert the first two lines and build the owned foundation before pursuing earned coverage. A journalist needs something to link to.
If your planning horizon is shorter than four quarters, you do not need a GEO budget this year and should not buy one. You will fund it, cut it, and conclude GEO does not work, when what you actually tested was your review cycle.
If your category has no measurable prompt demand, the allocation question is premature and the honest budget is zero this year.
Where Pepper fits and does not. We are built for programmes that can hold a four-quarter commitment, which is what this allocation needs. For a team under quarterly pressure we are the wrong partner, and saying so costs us the engagement rather than the argument.
Where to go next
Work out one number this week: what share of your current organic spend goes to sources you do not own. For most teams it is close to zero, and that gap is the whole finding.
Then decide whether you can hold a four-quarter commitment before you spend anything. For the adjacent decisions, our real pricing benchmarks for GEO cover what the market charges, what AEO costs covers the pricing models, how to build a GEO business case covers the board conversation, and the metrics worth tracking covers what to report. To see which sources win your category’s answers today, see where you show up.
Frequently asked questions
What should you budget for GEO in 2026?
Size it from your existing organic budget rather than creating a new line. Marketing sits at 7.8% of revenue across 401 CMOs surveyed, with SEO the largest line inside owned and earned digital. GEO is a reallocation within that figure.
How should a GEO budget be split?
Roughly 40% to earned authority work, 30% to the owned foundation and retrievability, 20% to measurement and prompt discipline, and 10% to refreshing the existing library. Paid placement gets nothing, because it earns 0.3% of citations.
Why should GEO not be a separate budget line?
A separate line invites a separate review cycle, usually quarterly, on work whose effects land three to five quarters out. That timing mismatch cancels more programmes than poor execution does.
Where do AI citations actually come from?
Earned media drives 84% of them, according to a study of more than 25 million links across ChatGPT, Claude and Gemini. Journalism alone accounts for 27%. Paid and advertorial content accounts for 0.3%.
Is there a benchmark percentage for GEO spend?
No defensible one exists, and anyone quoting one has invented it. Size from marketing spend as a share of revenue, then allocate against citation evidence rather than against a made-up category percentage.
How long should you commit a GEO budget for?
Four quarters minimum. Citation to traffic runs six to nine weeks, but citation to pipeline runs three to five quarters on enterprise cycles, so anything shorter tests your review cycle rather than the work.
Does paid coverage help AI visibility?
Barely. Paid and advertorial content accounts for 0.3% of AI citations across a 25 million link sample. Treat any proposal to buy placements as a citation strategy as a reason to question the whole plan.
What is the cheapest thing we can do first?
Reallocate. Most teams already spend enough on organic and spend it on the minority of the citation surface. Working out what share of your budget currently leaves your own domain costs nothing and usually changes the plan.
Sources and further reading
- Muck Rack, “What Is AI Reading?” May 2026 edition, the third instalment of the series. Method: more than 25 million links from ChatGPT, Claude and Gemini responses across 17 industries. Source of the 84% earned media figure, the 27% journalism figure, the 0.3% paid and advertorial figure, and the stability range of 82% to 89% for earned media across three editions going back to July 2025. Limitations: it measures which sources engines cite, not which citations influence a purchase, and it covers the whole web rather than any single category.
- Gartner CMO Spend Survey 2026, reported 24 June 2026. Method: 401 CMOs. Source of marketing budgets at 7.8% of revenue, the 8.9% and 11% figures for AI-strategist and AI-optimised organisations, and SEO taking the greatest share of mean budget at 9.4% among owned and earned digital channels, up from 8.9%. Limitations: the denominator behind the 9.4% figure is not stated unambiguously in the coverage we read, which is why this article uses the cascade as an order-of-magnitude check rather than a formula.
- Pepper, how much does generative engine optimization cost in 2026. Our benchmark of 30 published prices. That page answers what the market charges; this one answers what to budget and where to put it.
- Pepper, AEO vs SEO vs GEO. The source of our prior position that the real cost shift is reallocation toward earned media rather than adding separate programmes.
- Google Search Central, guide to optimizing for generative AI features, page last updated 10 July 2026. Source of the position that optimising for generative AI search is still SEO, and of the advice against guaranteed outcomes. Applies to Google Search only.
- The four-way allocation, the phasing by year and the worked cascade are ours. The cascade uses an illustrative $50 million revenue rather than any client’s figures, and the allocation weights are stated as priorities rather than measured coefficients.
Latest Blogs
Most advice on this is inference dressed as fact. OpenAI documents exactly one thing clearly, which is access. Here is what is documented, what is inferred, and how to verify the rest for yourself.
Being named in an AI answer and having your page used as its source are different outcomes with different causes and different fixes. The gap between them is the most useful diagnostic in AI search, and most reporting collapses it into one number.
Every platform reports share of voice and almost none of them define it the same way. Here is the definition worth using, the three choices that change the number, and how to measure it yourself without buying anything.
Get your hands on the latest news!
