AI search visibility metrics and KPIs: the 14 numbers that actually matter
Disclosure: Pepper published this guide and also offers a GEO platform that measures many of the metrics discussed below. To keep the analysis transparent, we’ve noted the scope of every metric, including those our platform measures, and highlighted areas where we believe the broader category can benefit from more rigorous interpretation. Where figures come from vendors operating in this space, we identify the source and position them alongside Pepper research drawing on its own data and third-party vendor data, rather than treating vendor-reported figures as standalone independent research.
The short answer
AI search visibility metrics are the numbers that tell you whether AI engines mention your brand, cite your pages, and influence the answer a buyer reads. There are 14 worth tracking, they split into four layers, and every one of them has a blind spot you need to be able to name before you put it in a board deck.
The mistake almost everyone makes is treating “visibility” as one number. It is three. Being mentioned, being cited, and actually influencing the answer are different events with different fixes, and a KPI set that collapses them tells you nothing about what to do on Monday.
Key takeaways
- Mention, citation and influence are three separate measurements. A brand can be named in an answer that cites six competitors and links to none of your pages. That is a citability problem, not an awareness problem, and the fix lives in PR and third-party sources rather than in your CMS.
- Citation counts are measuring an unreliable system. A Stanford-led evaluation of six commercial chatbots, published May 2026, found retrieval failures rather than reasoning errors caused more than 70% of all mistakes. Track citation accuracy as its own metric or your citation count is fiction.
- Traffic-shaped KPIs under-report AI search by design. Forrester’s 2026 survey of 18,000 global business buyers reports companies seeing 10% to 40% traffic declines as research moves into AI engines. If your reporting depends on sessions, you will conclude AI search does not matter while your buyers build their shortlist inside it.
- Almost every stat in this category comes from a vendor selling the category. We have used neutral research where it exists and labelled the vendor data where it does not.
- You do not need all 14. Pick five, weight them, and be able to defend each one. We give you the weighting we use and the scorecard we would apply to anyone selling you measurement.
A note on where this comes from. We run organic for more than 250 enterprises and track over 10 million prompts across every major engine, and the view below is shaped by that, by the client reviews we sit in every week, and by the conversations we have with buyers and operators at the events we run. Pepper is an agentic organic growth engine, so we have a commercial interest in you measuring this well. This is our read on the category, not a neutral directory.
What are AI search visibility metrics?
AI search visibility metrics are measurements of how often, how accurately and how prominently a brand appears in answers generated by AI engines such as ChatGPT, Perplexity, Google AI Overviews, Gemini and Claude. They replace the ranking-and-session model of traditional SEO, which assumes a results page and a click.
They divide into four measurement layers, and every one of them answers to one of three levers. We run everything through the Visibility, Citability and Retrievability framework, and it is the reason this list is 14 metrics rather than 40. A metric that does not tell you which lever to pull is a number, not a KPI.
| Layer | What it asks | Lever it reports on |
|---|---|---|
| Presence | Does the engine know you exist and put you in the answer? | Visibility |
| Answer quality | Is what it says about you correct, positive, and attached to the right source? | Citability |
| Source | Which pages and publications are feeding the answer, and are any of them yours? | Citability and Retrievability |
| Business | Did any of it produce demand you can bank? | All three, downstream |
The three levers are the diagnostic. Visibility is whether AI names you in your category at all. Citability is whether it trusts your pages enough to source from them. Retrievability is whether you surface however the question is phrased, rather than winning one wording and vanishing on the next.
Most reporting we inherit covers layer one and layer four, with nothing in between. That is the reason so many AI search programmes stall: the presence number goes up, the pipeline number does not move, and there is no diagnostic in the middle to explain why. If you want the shorter version of this argument, we wrote it up in what actually matters in AI search measurement.
Why did the old metrics stop working?
Rankings and sessions measure what happens after a click, and AI answers increasingly resolve the question before a click happens.
Forrester’s 2026 Buyers’ Journey Survey put numbers on how far this has gone. Across 18,000 global business buyers, the share using generative AI in a purchase process rose from 89% in 2025 to 94% in 2026, and twice as many named AI as their most meaningful research source than named any other. AI answer engines now outrank vendor websites, product experts and direct sales contact.
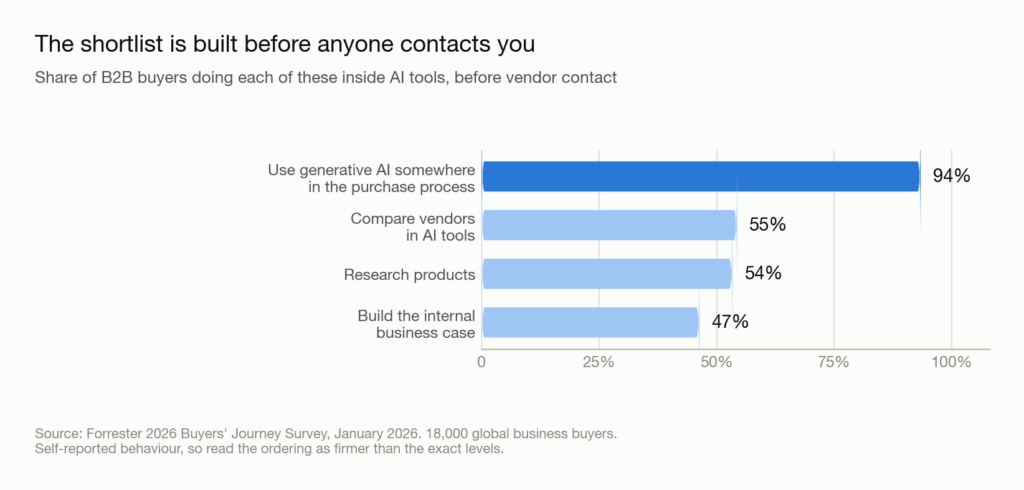
Read the middle three bars carefully. Comparing vendors, researching products and building the internal business case are the decisions that determine a shortlist, and all three now happen where your analytics cannot see them. By the time a buyer reaches your site, the evaluation is largely done.
The same survey reports companies seeing 10% to 40% traffic declines as research migrates into AI engines. If sessions are your KPI, that decline reads as failure. It is often the opposite: the answer is being resolved upstream, and whether you are in it is the thing you stopped measuring.
This is the most common problem we are called in to fix. A team reports flat or falling AI referral traffic, concludes the channel is immature, and stops. Six months later their category’s answers name three competitors and not them, and rebuilding that position costs far more than holding it would have.
Our point of view: mention, citation and influence are three different things
The category sells you one number called “AI visibility”, and one number cannot tell you what to do.
An engine can name your brand in a sentence and cite a comparison site for the claim. It can cite your documentation page and never name you in the prose. It can do both and still lean primarily on a Reddit thread that shaped the recommendation. Those are three different outcomes, they have three different causes, and they need three different fixes.
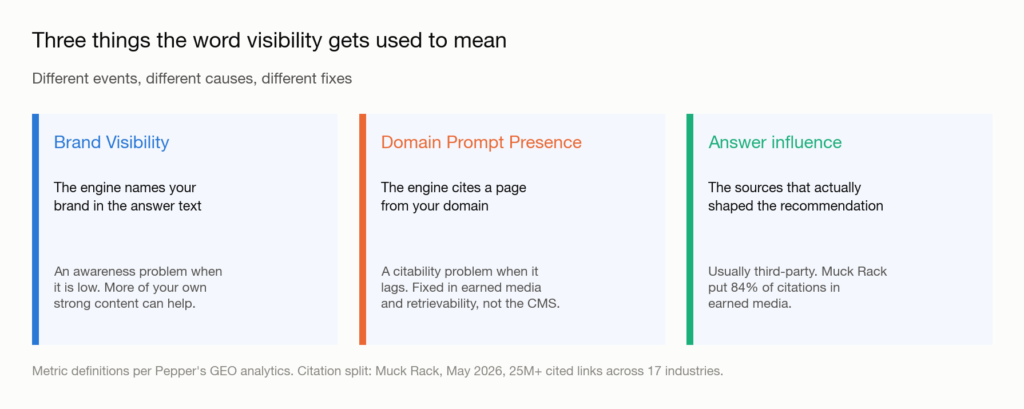
Pepper’s GEO platform separates the first two by design, because the gap between them is the most useful diagnostic we have:
- Brand Visibility is how often engines mention your brand by name.
- Domain Prompt Presence is how often engines cite a page from your domain.
- Share of Voice is your slice of all brand mentions in the category.
When Brand Visibility is healthy and Domain Prompt Presence is flat, you have a citability problem. The engine knows who you are and does not trust your pages enough to source from them, which means it is sourcing from someone else. That is not solved by publishing more blogs. It is a Citability problem, and citability is earned in third-party sources and technical retrievability rather than in your CMS. This is the lever most programmes never diagnose, because their reporting collapses it into a visibility number.
The evidence for where the sourcing actually goes is not close. Muck Rack’s May 2026 analysis of more than 25 million links cited by ChatGPT, Claude and Gemini across 17 industries found 84% of AI citations come from earned media, with paid and advertorial content at 0.3%. The figure has held between 82% and 89% across three editions since July 2025, so treat it as a stable range rather than a single constant. The direction does not vary.
If you want to see this on your own category before you build any of it, book a growth audit and we will run your prompt set and show you where the gap sits. If you would rather do it yourself, that is a legitimate answer too, and the rest of this guide is written so you can.
Our methodology: how we weighted these 14 metrics
We weighted the four layers by how much each one changes a decision, not by how easy each is to measure. Ease of measurement is why the category over-reports presence and under-reports source, and it is the wrong basis for a KPI set.
| Layer | Weight | Why it carries this much |
|---|---|---|
| Source and citation quality | 35% | Tells you where the answer is actually being decided, and therefore what to do next. The most under-measured layer and the most actionable |
| Presence | 25% | The starting position. Necessary, easy to game, and meaningless on its own |
| Business impact | 25% | The only layer a CFO will accept, and the one most vendors stop short of |
| Answer quality and accuracy | 15% | Lower weight only because it moves slowly. When it breaks, it is the most expensive problem on this list |

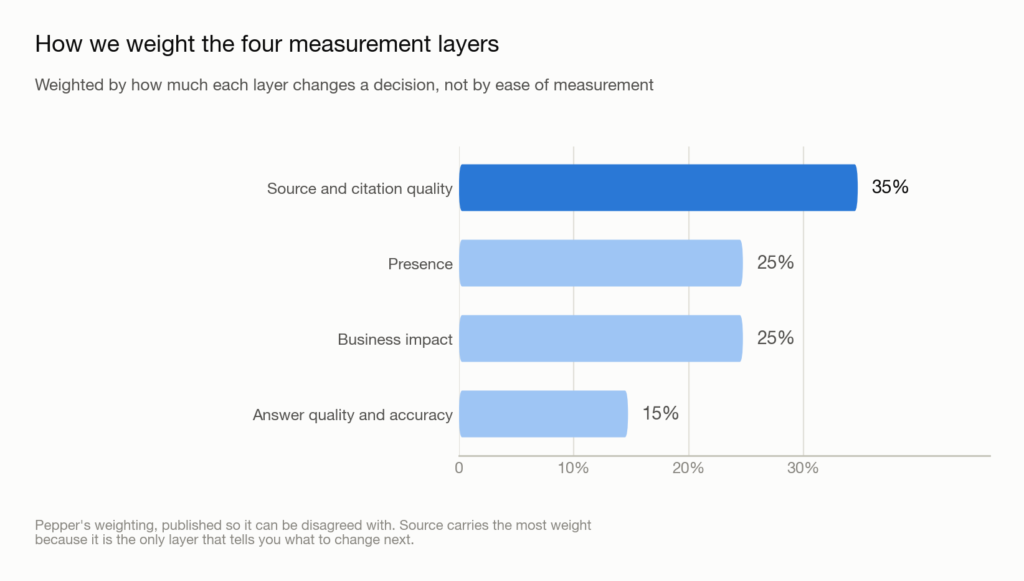
Source quality carries the most weight because it is the layer that answers “so what do we do”. Presence tells you that you have a Visibility problem. Source tells you whether it is really a Citability or Retrievability problem, which is the difference between commissioning content and commissioning digital PR. We apply the same principle when we rank GEO agencies: weight the criteria that change a decision, publish the weights, and let people disagree with them.
The 14 metrics at a glance
| # | Metric | Layer | Lever | Where you get it | Cost to measure |
|---|---|---|---|---|---|
| 1 | Brand Visibility (mention rate) | Presence | Visibility | GEO platform | Platform subscription |
| 2 | Domain Prompt Presence (citation rate) | Presence | Citability | GEO platform | Platform subscription |
| 3 | Share of Voice | Presence | Visibility | GEO platform | Platform subscription |
| 4 | Prompt coverage | Presence | Retrievability | GEO platform, or manual | Free manually, badly |
| 5 | Answer position and prominence | Presence | Visibility | GEO platform | Platform subscription |
| 6 | Citation accuracy | Quality | Citability | Manual audit, no tool does this well | Analyst time, recurring |
| 7 | Sentiment in the answer | Quality | Visibility | GEO platform | Platform subscription |
| 8 | Factual accuracy about you | Quality | Citability | Manual audit | Analyst time, recurring |
| 9 | Competitor displacement | Quality | Visibility | GEO platform | Platform subscription |
| 10 | Cited URL mix, owned versus earned | Source | Citability | GEO platform, or manual | Platform subscription |
| 11 | Citation Core coverage | Source | Citability | Manual, then tracked | Analyst time up front |
| 12 | Cross-engine overlap | Source | Retrievability | GEO platform | Platform subscription |
| 13 | AI referral traffic and its behaviour | Business | Downstream | GA4, with caveats | Free, unreliable |
| 14 | Branded search lift | Business | Downstream | Search Console, GA4 | Free |
This table is the only place tooling is named. The per-metric entries below cover how each number is calculated, how to read it and why it might be falling, because those are the parts that decide what you do next.
Free is not the same as cheap. The metrics marked free take the most analyst time to make trustworthy, and the two most valuable on this list, citation accuracy and Citation Core coverage, are not properly automated by anyone, including us.
The 14 metrics in full
Each one gets the same five fields: what it measures, how it is calculated, how to read it, why it might be falling, and where it falls short. The “why it might be falling” field is the one most reporting omits, and it is the field that turns a number into an action.
Layer one: presence
1. Brand Visibility (mention rate)
What it measures. How often engines name your brand in answers to a defined prompt set.
How it is calculated. Prompts where your brand is named, divided by total prompts run, expressed as a percentage. Run per engine, then averaged only if you are prepared to lose the per-engine detail. A brand named twice in one answer still counts once.
How to read it. There is no universal good number, and any vendor quoting one invented it. In a category with three obvious incumbents, 30% to 50% is a strong position; in a fragmented category, 10% can lead. Read it two ways only: your own trend over at least eight weeks, and your distance from the category leader in the same prompt set.
Why it might be falling. Competitors published something the engines picked up. A model version changed and re-weighted its sources, which happens without warning and shows as a step change rather than a drift. Your prompt set was expanded into territory you do not own, which is a measurement artefact rather than a real decline. Or a third-party source that used to describe you went stale, moved or dropped you.
Where it falls short. It is entirely dependent on the prompt set, which makes it the easiest metric here to flatter. Pepper’s GEO platform shows the underlying answers behind every mention for this reason, and you should expect the same from any vendor. Add ten branded prompts and visibility improves while nothing has changed. Ask any vendor how they select prompts before accepting a single visibility number from them.
2. Domain Prompt Presence (citation rate)
What it measures. How often engines cite a page from your domain as a source.
How it is calculated. Prompts where at least one cited URL is on your domain, divided by total prompts run. Count distinct prompts, not distinct URLs, or a single heavily cited page will distort the picture.
How to read it. Read it against Brand Visibility, never alone. The ratio is the diagnostic. If Brand Visibility is 40% and Domain Prompt Presence is 8%, engines know you and do not trust your pages, and the work is citability. If both are low, the work is visibility first. If Domain Prompt Presence approaches Brand Visibility, you are being used as a primary source, which is the strongest position available.
Why it might be falling. A technical change made pages harder to retrieve: a migration, a robots.txt edit, a shift to client-side rendering, a slower origin. A third-party source displaced you for queries you used to source. Your pages aged relative to fresher competitors on time-sensitive queries. Or the engine changed how much it cites at all, which is a platform-level move you cannot influence and should not over-correct for.
Where it falls short. It goes up when you are cited for something trivial. Volume without prominence is not progress. Partial first-party corroboration exists in Bing’s AI Performance report, in public preview since 10 February 2026, but Microsoft is explicit that it covers Copilot, Bing AI summaries and select partner integrations, on a sampled basis, counting citations rather than visits. It is not a window into ChatGPT. We go deeper in our breakdown of citation rate.
3. Share of Voice
What it measures. Your slice of all brand mentions in your category across the tracked prompt set.
How it is calculated. Your brand mentions divided by total brand mentions across all competitors in the same prompt set. Requires a defined competitor list; three to ten is the workable range, and beyond that the denominator becomes noise.
How to read it. It is a relative measure, so it only means something next to the competitor set you defined. Rising share with flat mentions means competitors are losing ground rather than you gaining it. Both matter, but they call for different responses, so always read it beside Brand Visibility.
Why it might be falling. A competitor launched a campaign, a funding round or a research asset that earned citations. A new entrant joined the answer set. Or you added competitors to the tracked list, which mechanically dilutes your share without anything changing in the market.
Where it falls short. A rising share in a shrinking category is a bad outcome that looks like a good one. It also says nothing about absolute demand, so it can improve while your pipeline does not.
4. Prompt coverage
What it measures. How much of the real question space in your category you are tracking at all.
How it is calculated. Prompts tracked, divided by your best estimate of the commercially relevant question space, built from sales-call language, Search Console queries and support tickets rather than from a keyword tool.
How to read it. As a trend, never as a level, because the denominator is an estimate and always will be. The useful question is whether your tracked set is growing in the areas where you are absent, or only in the areas where you already win.
Why it might be falling. It rarely falls. It usually reveals itself as too narrow when a sales team asks about a question the tracked set never covered. Treat that as the real signal.
Where it falls short. There is no honest denominator. Nobody knows the true size of the question space in a category, so any coverage percentage is a claim about your own assumptions. Add three to five prompts at a time and give them a fortnight before reading anything into them.
5. Answer position and prominence
What it measures. Where in the answer you appear, how much space you get, and whether you are the recommendation or an also-ran.
How it is calculated. Vendors weight placement, mention count and snippet length into a prominence score. Every implementation is proprietary and none are comparable across tools.
How to read it. Internally only, as a trend line on a fixed prompt set. Moving from a closing-list mention to a leading recommendation on the same prompt is real progress even when mention rate is flat.
Why it might be falling. A competitor became the more natural default answer. Your positioning became less specific, so the engine reaches for you later in the answer. Or the engine changed answer length, which compresses everyone and shows up as a decline you did not cause.
Where it falls short. Proprietary and unstandardised, so it is never an industry benchmark and cannot be compared between vendors. Treat any cross-tool prominence comparison as marketing.
Layer two: answer quality
6. Citation accuracy
What it measures. Whether the engine attributes a claim to the correct source at all.
This is the metric almost nobody sells, and we think it belongs in every serious KPI set. A Stanford-led evaluation of six commercial chatbots, published 21 May 2026, ran 2,100 factual questions across a fourteen-day window in February 2026 and found something directly relevant to anyone doing this work: retrieval failures, not reasoning errors, accounted for more than 70% of all mistakes. When the models retrieved the right source, they usually extracted the right answer.
How it is calculated. Sample 30 to 50 answers where you are cited, check each citation resolves to a page that actually supports the claim, and express correct attributions as a percentage of citations checked. There is no way to automate this honestly today.
How to read it. As a floor, not a target. If a meaningful share of your citations point at the wrong page or misattribute your claim, your citation count is overstating your position, and any reporting built on it inherits the error.
Why it might be falling. Your content became harder to retrieve accurately: ambiguous headings, claims separated from their evidence, statistics without a nearby source line. Our guide to structuring content for AI citation covers the fixes. A model version changed. Or you published something that reads as similar to a competitor’s claim, and the engine merged the two.
Where it falls short. Expensive, manual, and it does not automate. The 2026 research above tested news rather than commercial queries, so read it as indicative of the mechanism rather than as a benchmark for your category.
7. Sentiment in the answer
What it measures. Whether the engine describes you positively, neutrally or negatively.
How it is calculated. A classifier scores each mention, usually on a three-point scale, and results are aggregated across the prompt set.
How to read it. Neutral and accurate is the correct outcome for most B2B categories, not a problem to fix. What matters is the appearance of negative mentions and what is sourcing them, not the aggregate score.
Why it might be falling. A critical review, forum thread or news item entered the source set. A pricing or policy change generated commentary. Or a competitor’s comparison page is being cited when describing you, which is common and fixable through your own comparison content.
Where it falls short. Sentiment classifiers are blunt on B2B language, where measured description reads as neutral and caveats read as negative. Chasing a positive sentiment score is how teams end up optimising for adjectives.
8. Factual accuracy about you
What it measures. Whether what the engine says about your product, pricing, category and customers is true.
How it is calculated. Build a checklist of your own verifiable claims, ask each as a direct question across engines, and score answers as correct, outdated or wrong.
How to read it. Zero tolerance on pricing, compliance and category claims. Outdated is a different problem from wrong: outdated means your correct information is not being retrieved, wrong means a bad source is winning.
Why it might be falling. You repositioned, renamed a product or changed pricing and the sources describing you have not caught up. This is the single most common cause we see, and it is entirely self-inflicted. Update your own pages first, then the third-party profiles, then re-test.
Where it falls short. Manual, and it needs a subject matter expert rather than an analyst. Shortest half-life of anything on this list. Run it quarterly and after every launch or pricing change.
9. Competitor displacement
What it measures. Which competitors appear in the answers where you do not.
How it is calculated. For every prompt where you are absent, record which brands appear and which URLs are cited. Rank competitors by the count of prompts where they displace you.
How to read it. As a targeting list, not a scoreboard. The value is identifying the ten or twenty prompts where one competitor consistently beats you, then reading the sources behind those specific answers.
Why it might be falling. If displacement is rising, a competitor has usually earned a source rather than published a page. Check third-party comparison sites, review platforms and community threads before you check their blog.
Where it falls short. It tells you who is winning without telling you why. On its own it produces anxiety rather than action. Always pair it with the cited URL mix for the same prompts.
Layer three: source
10. Cited URL mix, owned versus earned
What it measures. The split between your own pages and third-party sources in the answers where you appear.
How it is calculated. Classify every cited URL in your tracked answers as owned, earned, or paid, and express each as a share of total citations.
How to read it. Against your category, not against a benchmark. The direction of the evidence is clear: Muck Rack’s May 2026 analysis of more than 25 million links cited by ChatGPT, Claude and Gemini across 17 industries found 84% of AI citations come from earned media, with paid and advertorial content at 0.3%. If your mix is overwhelmingly owned, you are the exception, and usually because your tracked prompts are branded.
Why it might be falling. Your owned share falling is often good news, because it usually means earned citations grew. Read the absolute numbers before reacting to the ratio.
Where it falls short. A healthy mix looks different by category. Regulated categories lean far harder on regulator and third-party sources, and no cross-industry benchmark is worth applying.
11. Citation Core coverage
What it measures. Whether the ten to twenty sources that decide your category describe you, and describe you consistently.
How it is calculated. Identify the sources cited most often across your tracked prompts, take the top ten to twenty, and score each on whether you appear, whether the description is current, and whether it matches how you describe yourself.
How to read it. As a checklist, not a percentage. Twelve of twenty describing you correctly is a clear brief for the next quarter. This is the highest-leverage item on this page and the one most brands cannot answer at all.
Why it might be falling. A roundup dropped you, a comparison page was rewritten, a review profile went stale, or a publication changed its category framing. Each is fixable, and each requires outreach rather than publishing.
Where it falls short. Building the list is judgement work, and the list drifts. Nobody automates this well, including us.
12. Cross-engine overlap
What it measures. How much your visibility on one engine predicts your visibility on another.
How it is calculated. For the same prompt set, compare the sets of cited sources per engine and express the intersection as a share of the union.
How to read it. Low overlap is the normal state, not a failure. The citation selection and absorption study covering 602 controlled prompts and more than 21,000 search-layer citations found breadth and depth diverge by engine: Perplexity and Google cite more sources on average, while ChatGPT cites fewer but with higher average influence on the answer.
The engines do not even agree on whether to cite at all.
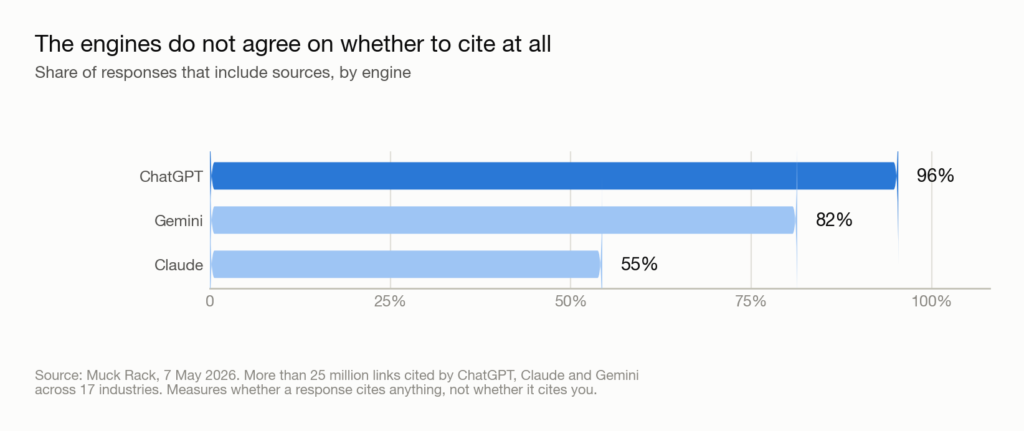
Claude cites a source in barely half its responses while ChatGPT does so in almost all of them. A single cross-engine average would sit near 78% and describe none of the three. This is the practical reason to report per engine and to treat any blended visibility number with suspicion.
Why it might be falling. Falling overlap usually means one engine changed its retrieval behaviour, not that you lost anything. Investigate per engine before concluding anything about your programme.
Where it falls short. It is a diagnostic, not a target. There is no correct overlap number to aim for, and averaging across engines produces a figure that describes none of them.
Layer four: business impact
13. AI referral traffic and its behaviour
What it measures. Sessions arriving from AI engines, and what they do next.
How it is calculated. Segment sessions by referrer in GA4, using the referrer patterns each engine sends. Coverage is incomplete and inconsistent between engines, so treat the absolute number as a floor.
How to read it. For behaviour, not for reach. Engagement rate, pages per session and conversion rate on this segment tell you whether AI-sourced visitors arrive with intent. The volume number will always undercount.
Why it might be falling. Falling AI referral traffic while citations rise is the normal pattern, not a problem, because more answers resolve without a click. Falling on both is the signal worth chasing.
Where it falls short. It undercounts by design. Forrester’s 2026 Buyers’ Journey Survey of 18,000 global business buyers reports companies seeing 10% to 40% traffic declines as research migrates into AI engines, which means a falling number here can coexist with rising influence. If this is your primary KPI you will draw the wrong conclusion from it.
14. Branded search lift
What it measures. Growth in people searching for you by name, which is the shadow AI search casts in data you already own.
How it is calculated. Branded query impressions and clicks in Search Console, tracked month over month, ideally split by exact brand name versus brand-plus-category.
How to read it. As corroboration only. A sustained rise in branded search alongside rising Brand Visibility is the closest thing to proof most teams will get that AI visibility is creating demand.
Why it might be falling. Seasonality, a paused campaign, a PR cycle ending, or a competitor’s campaign capturing category attention. Almost never AI search alone.
Where it falls short. Contaminated by everything else you do. PR, paid, events and launches all move branded search, so isolating AI’s contribution needs either a quiet period or a control, and most teams have neither. Use it as corroboration, never as proof.
What does measuring this actually cost?
Three cost models exist, and the honest answer is that the tooling is the cheap part.
Self-serve monitoring platforms. Entry-level tools start in the low hundreds per month. Mid-market GEO platforms typically land in the four-figure monthly range, and enterprise platforms frequently do not publish pricing at all. Profound, for example, publishes none. Where a vendor gates pricing, assume a procurement conversation rather than a card payment.
Analyst time. This is the cost nobody quotes. Citation accuracy, factual accuracy and Citation Core identification are manual, recurring, and need someone senior enough to make judgement calls. Budget for a meaningful slice of an analyst’s month, every month, not a one-off audit.
Execution capacity. The largest cost by far, and the one that decides whether any of the above was worth buying. A dashboard that surfaces two hundred fixes nobody has time to make has added a backlog, not a capability. We see this pattern constantly in accounts we take over: good tooling, clean data, no hands.
Pepper does not publish pricing, so we are not going to pretend to give you a number here. What we will say is that the split matters more than the total. If you are spending more on measuring than on changing anything, you have bought a mirror.
How to choose which AI search metrics to track, and who to trust with them
Choosing your AI search KPIs is less about finding the longest list of things you could measure and more about picking the handful you can defend, act on, and connect to pipeline. Most teams get this backwards: they buy a platform, adopt whatever it reports by default, and end up with a KPI set designed by a vendor’s product roadmap rather than by their own strategy.
One shift worth reading before you choose anything. Google’s first official AI search optimisation guide, published 15 May 2026 on Search Central and filed under SEO fundamentals, states plainly that AEO and GEO are part of SEO from Google’s perspective, that AI Overviews and AI Mode run on core Search ranking systems with no separate AI index, and it mythbusts llms.txt, content chunking, AI-specific rewrites, inauthentic mentions and structured-data over-optimisation. Google also specifically advises companies evaluating AEO and GEO services to check whether the advice aligns with official search guidance.
Google is right, for Google. And Google is one engine among several. ChatGPT, Perplexity and Claude do not run on Google’s ranking systems, they retrieve differently from each other, and a measurement programme built only around Google’s guidance will be blind on the surfaces where a lot of B2B research now happens.
The 100-point scorecard I would use
If I were choosing a measurement approach or a partner to run it, this is how I would weight the evaluation. It is a 100-point scale, and the weights are the argument.
| Area | Weight | What a strong partner should demonstrate |
|---|---|---|
| Visibility measurement depth | 25% | Tracks brand mentions, citations, cited URLs, competitors, share of voice and answer positioning across a meaningful prompt set, and can show the raw answers behind every number rather than screenshots |
| Prompt and query intelligence | 20% | Understands what your ICP asks from awareness through consideration to purchase, can explain their prompt selection methodology unprompted, and identifies where you are absent rather than only where you appear |
| Content and technical execution | 20% | Can actually change site architecture, crawlability, entity clarity, content structure, evidence and schema, not simply hand you a list of recommendations |
| Off-site and earned authority | 15% | Understands that engines retrieve from the wider web, and has real capability in digital PR, comparison sites, communities and third-party sources where the answer is usually decided |
| Multi-engine capability | 10% | Measures ChatGPT, Google AI experiences, Perplexity, Gemini and Copilot as separate systems, rather than claiming one universal algorithm and reporting an average |
| Business attribution | 10% | Connects visibility to traffic to conversions and pipeline, instead of treating citation count as the final KPI |
Measurement is weighted highest because it is the fastest way to separate serious operators from marketing. First-party citation data now exists in places it did not a year ago: Bing exposes AI citation data through its AI Performance reporting, and OpenAI runs OAI-SearchBot, ChatGPT-User and GPTBot as distinct agents with distinct jobs, while Perplexity runs PerplexityBot and Perplexity-User for scheduled indexing and on-demand fetching. How you handle each one has different consequences. A partner who cannot discuss any of that is selling you a dashboard.
Ask them to show you this before you sign anything
Give them 20 to 30 real commercial questions from your category and ask for a mini audit. Not a capabilities deck. An audit.
For example:
- “Best enterprise content marketing platforms”
- “Best alternatives to [your closest competitor]”
- “How should a B2B SaaS company improve visibility in ChatGPT?”
- “Which platform should I use for [your category]?”
Then ask them to show you five things: where does my brand appear today, which competitors appear instead of me, which sources are influencing those answers, why are those sources winning, and what exactly would you change in the next 90 days.
That conversation tells you more than fifty slides, and it exposes the difference between a vendor who has read about this and one who has done it.
A sophisticated partner will also tell you, unprompted, that AI answers are probabilistic. The citation measurement research above found engines diverge substantially in both which sources they select and how much those sources shape the answer, which means one query run on one engine establishes nothing at all. If someone shows you a single flattering screenshot as evidence, you have learned something about them.
The weak playbook and the strong one
The weaker approach looks like this: find some prompts, rewrite a few blogs, add FAQ blocks, sprinkle in statistics, hope an engine cites them.
The stronger model looks like this: demand intelligence, then technical discoverability, then entity and brand authority, then content, then earned-media authority, then distribution, then visibility measurement, then revenue attribution.
That distinction matters because generative engines synthesise an answer from multiple sources rather than ranking one page. Source selection, citation and actual influence on the answer are three different things, and a programme that only optimises the page you own is competing for a fraction of what decides the outcome.
Red flags
A partner saying “we guarantee ChatGPT citations” should end the meeting. Google explicitly advises against providers guaranteeing rankings, because third parties do not have access to internal ranking systems, and nobody has that access for ChatGPT either.
I would also be cautious if their entire proposition is a dashboard; if they optimise exclusively for ChatGPT; if they produce hundreds of AI-generated articles; if they cannot explain their methodology for prompt selection; if they report citation counts with no competitor share of voice; or if they have no capability in technical SEO, digital PR and content execution. Any one of those is survivable. Three together is a pattern.
The five questions that would decide it for me
- “Show me exactly how you measure visibility.” They should show actual prompts, competitors, citations, cited URLs and engines. If the answer is a single composite score, ask what goes into it and watch what happens.
- “Take one query where a competitor beats us. Explain why.” This separates people who understand retrieval and source authority from people reading a dashboard aloud.
- “What would you actually change?” Look for an answer spanning technical, owned content and earned authority. A content calendar on its own is not a GEO strategy.
- “How do you prove this generates business?” Their measurement should reach branded demand and qualified pipeline, not stop at “AI visibility increased 34%”.
- “Which part of your methodology do you think will be obsolete in 12 months?” The field moves fast. A thoughtful answer here beats a confident one, and anyone who claims permanence has not been paying attention.
If I had to reduce the whole decision to one principle: choose the approach that treats AI search as a measurable growth system, not a new name for content services.
One honest closing note, and it costs us something to say it. The partner who wins this should combine visibility measurement, content execution, digital PR and authority building, and analytics. Very few companies are equally strong across all four, ours included, and the strongest of them will tell you which one is their weakest. That is exactly where your evaluation should focus.
What nobody should promise you
A guaranteed position in an AI answer. Nobody controls the ranking systems, and the engines themselves change weekly. Pepper will not promise this and neither should anyone else.
A single AI visibility score. Composite scores hide the diagnostic. If Brand Visibility is up and Domain Prompt Presence is flat, a blended score moves gently upward while your actual problem goes unnamed.
A benchmark for what good looks like. There is no universal good number for these metrics, and anyone selling you one is selling you a number they made up. What matters is your trend and your distance from the category leader.
Results measured on one engine. Engines differ substantially and overlap little. Single-engine proof is not proof.
Attribution that closes cleanly to revenue. It does not, yet. Anyone claiming a clean line from AI citation to closed deal is overstating what the data supports. Corroborate with branded search lift and qualified pipeline, and be honest about the gaps.
Frequently asked questions
What are the most important AI search visibility metrics?
The four that matter most are Brand Visibility, Domain Prompt Presence, Share of Voice and cited URL mix. Together they tell you whether engines know you, trust your pages, how you compare to competitors, and where the answer is actually being sourced from.
How do you measure AI search visibility?
Define a prompt set that reflects real buyer questions, run it across ChatGPT, Perplexity, Gemini, Claude and Google AI Overviews on a schedule, and record mentions, citations, cited URLs and competitor appearances. Manual spot checks confirm accuracy, which no platform measures reliably.
Is AI referral traffic a good KPI?
Only for quality, not volume. Forrester’s 2026 survey reports companies seeing 10% to 40% traffic declines as research moves into AI engines, so referral counts undercount by design. Use the segment to read engagement and conversion behaviour rather than reach.
What is a good AI visibility score?
There is no universal good number, and any vendor quoting one is inventing it. Visibility varies enormously by category, engine and prompt set. Track your own trend over time and your gap to the category leader instead of chasing an external benchmark.
How often should we measure AI search visibility?
Monthly for presence and share of voice, quarterly for the manual metrics like citation accuracy and factual accuracy. Weekly tracking mostly captures noise, because engine outputs vary between runs even when nothing about your content has changed.
What is the difference between a mention and a citation in AI search?
A mention names your brand in the answer text. A citation links to a page on your domain as a source. You can have either without the other, and the gap between them is usually a citability problem solved through earned media rather than more content.
Can you track AI search visibility for free?
Partly. Branded search lift comes from Search Console, and Bing’s AI Performance report gives first-party citation data at no cost. Everything involving multi-engine prompt tracking at scale needs either a platform subscription or a lot of analyst time.
Do AI engines cite sources accurately?
Often not. A Stanford-led evaluation of six chatbots across 2,100 questions in February 2026 found retrieval failures, not reasoning errors, caused more than 70% of mistakes. Track citation accuracy separately rather than assuming it.
Where to go next
If you are building this from scratch, start with the prompt set and the Citation Core. Everything else on this page is downstream of knowing which questions matter and which sources decide them.
If you already have a platform and flat numbers, the diagnostic is the gap between Brand Visibility and Domain Prompt Presence. Run that comparison first, then map the result onto the three levers: a Visibility problem, a Citability problem or a Retrievability problem. Those have completely different fixes, and picking the wrong one is how teams spend a year publishing content to solve a citability gap. Our sibling guide on what to track and what to ignore is the shorter companion to this piece, and zero-click versus AI citation covers the traffic question in more depth.
If you want to see the numbers on your own category before committing to any of it, see where you show up in the engines your buyers use. Customers run this themselves inside the platform, with a growth team attached to do the work alongside them. For a worked example of what the compound effect looks like over time, our Acceldata case study documents 6X organic traffic growth and top-three keywords going from 85 to more than 300.
And if your category has very few meaningful monthly prompts, or you have no capacity to act on what you would find, you do not need a measurement platform yet. Fix the capacity problem first. We would rather tell you that now than sell you a dashboard you will not use.
Sources and further reading
Every study cited here was published in 2026. Research from 2025 was deliberately excluded, because engine behaviour, model versions and buyer habits have all moved enough that 2025 figures now describe a different system. Where a source is a vendor competing in this category, it is labelled.
- Forrester, 2026 Buyers’ Journey Survey, reported in “GenAI Is Upending B2B Buying”,
- Suzgun, Shen, Bianchi, Spangher, Icard, Ho, Jurafsky and Zou, “Evaluating Commercial AI Chatbots as News Intermediaries”, arXiv:2605.22785
- “From Citation Selection to Citation Absorption: A Measurement Framework for Generative Engine Optimization Across AI Search Platforms”, arXiv:2604.25707
- Muck Rack, “Earned media still drives 84% of AI citations”,
- Google Search Central, AI features and your website,
Latest Blogs
Healthcare SEO advice has one dominant theme: this is YMYL, so build clinical authority. An analysis of 824,997 health citations shows that advice is correct and badly incomplete. Only 17.3 percent of citations go to authoritative medical sources. Three quarters go somewhere else entirely.
Three questions bring people here and only one of them has a clean answer. Profound no longer publishes prices. The $99 Starter and $399 Growth tiers that most comparison pages still quote, including one of ours, are gone from its pricing page, which now shows a free trial and a custom Enterprise tier. The trial is specified in detail and is genuinely useful: 50 prompts run daily for seven days across three engines, with unlimited seats. On reviews, the counts in circulation range from 140 to over 1,100, so we publish no rating at all.
On 3 August 2026 the IAB published the first industry standard for measuring AI visibility. It splits measurement into two tiers: Directional, which it says supports early signal detection but is unsuitable for budget decisions, and Decision-Grade, which requires rigour on query volume, sample size and reproducibility. We then checked what nine leading citation platforms publish about their own methods. Reproducibility is the requirement almost nobody meets, and our own earlier census of fourteen platforms found not one disclosing run-to-run variance.
Get your hands on the latest news!