GEO KPIs: which three to use, and what target to set
The short answer
Use three. One board number, two programme numbers, and everything else demoted to a diagnostic. A number only earns KPI status when a named person changes a named action once it crosses a stated threshold. And set that threshold from your own baseline and your named competitors, because the published GEO benchmarks that appeared this year contradict each other badly enough to be unusable.
Key takeaways
- Picking metrics is the easy half. Our own guide to the fourteen numbers that actually matter covers selection and says to pick five. This article covers the half nobody covers: what target to set once you have.
- We read four published 2026 GEO benchmark sets. None publishes a sample size, an engine list or a prompt count. Every one presents its ranges as established fact.
- They contradict each other. For share of voice, one says above 40% is strong and leaders rarely exceed 60%. Another says 15% to 25% is strong. Those ranges barely touch.
- One source reports IT sector share of voice at 2.80%. Under another source’s ranges, that puts an entire industry in permanent “significant citation gap” territory. Both cannot be describing the same quantity.
- “Citation rate” is a percentage in one source and a count per month in another. Same metric name, different units, no way to compare.
- So use relative and self-referenced targets. Measure against named competitors on the same prompt set on the same day, and against your own trailing baseline. Both cancel the measurement error that absolute benchmarks hide.
- Pepper is an agentic organic growth engine and an organic growth partner. Agent Atlas puts the agents in your team’s hands. Pepper’s GEO platform reports Brand Visibility, Domain Prompt Presence and Share of Voice. A growth team works alongside yours. Eight years, more than 250 enterprises, more than 10 million tracked prompts.
A note on where this comes from. The question I get in almost every quarterly review is not which metric to use. It is whether the number we just showed is good. For most of the GEO metrics in circulation, the honest answer is that nobody can tell you, and the industry has spent 2026 publishing numbers that pretend otherwise. Pepper runs organic for more than 250 enterprises over eight years and tracks more than 10 million prompts across every major engine, and we still set targets from a client’s own baseline rather than from a category average.
Disclosure: Pepper sells a platform that reports several of the metrics discussed here, and we argue below that no vendor should publish a universal benchmark for them. That includes us, and we do not. The four benchmark sources we checked are named by their publication date and method rather than linked, because several are direct competitors. Every figure came from that page on 23 September 2026.
What are GEO KPIs, and which ones should you use?
A GEO metric is any number describing how generative engines treat your brand. A GEO KPI is the small subset of those numbers that changes somebody’s behaviour. The distinction is not pedantic, and it is the whole basis for choosing.
Here is the test I apply, and it disqualifies most dashboards.
A number is a KPI only if you can complete this sentence: when this crosses X, [named person] will do [named thing]. If you cannot name the person, the threshold or the action, you have a diagnostic. Diagnostics are useful and belong in the appendix. They do not belong on the wall.
Applying that test does two things. It cuts a fourteen-metric dashboard down to about three, and it forces you to set a threshold, which is where the real difficulty starts.
The problem nobody in this category will tell you about
A threshold needs a reference point. There are exactly three places to get one.
- An absolute benchmark. An industry number that says what good looks like.
- A relative target. Your position against named competitors, measured the same way, on the same prompt set, on the same day.
- A self-referenced target. Your own trailing baseline, with a threshold wide enough to clear sampling noise.
Almost every GEO dashboard sold in 2026 implies the first one. So we went and checked whether it exists.
We checked four published 2026 GEO benchmark sets
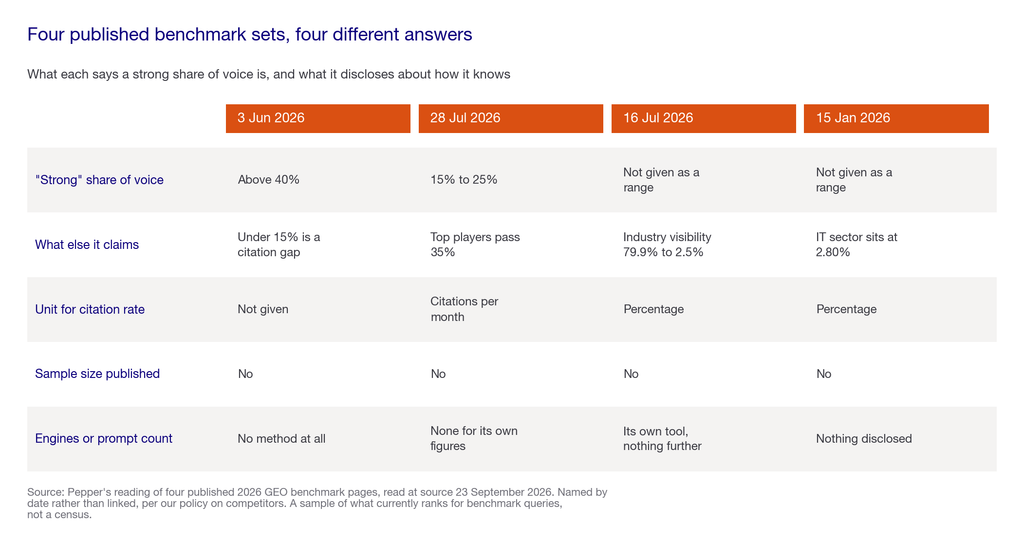
Four sources, all published or updated in 2026, all presenting benchmark ranges as settled fact.
None of the four publishes a sample size, an engine list or a prompt count. One states only that the data comes from its own monitoring tool. One gives no method at all and presents its ranges as general guidance. One cites external references for other claims but declares no sample for its own numbers. The fourth discloses nothing.
That alone should stop you using any of them as a target. But it gets worse, because they also disagree.
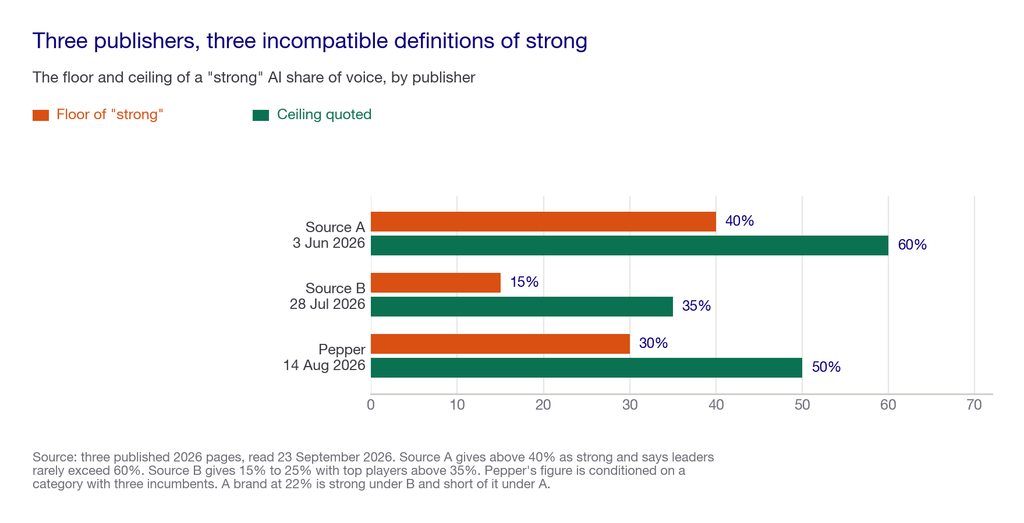
For share of voice, “strong” means:
- Above 40%, on a page dated 3 June 2026, which adds that even category leaders rarely exceed 60% and that anything under 15% is a significant citation gap.
- 15% to 25%, on a page dated 28 July 2026, which adds that top players often surpass 35%.
- 30% to 50% in a category with three obvious incumbents, and 10% can lead in a fragmented one, on our own page of 14 August 2026, which at least conditions the answer on category structure.
A brand sitting at 22% is comfortably strong under the second, a significant gap away from strong under the first, and unclassifiable under the third without knowing its category structure. Same metric, same year, three incompatible verdicts.
Then there is the detail that settles it. A fourth source reports actual share of voice by sector: Information Technology 2.80%, Consumer Staples 1.91%, Healthcare 0.84%. If those are share of voice figures, then under the first source’s ranges every company in IT is in a significant citation gap, permanently, with no path out. They are not measuring the same quantity. They are using the same words for different ones.
And the units do not even agree. One source expresses citation rate as a percentage and targets above 30%. Another expresses it as citations per month and reports 31.0 for the top quartile against 3.7 for the bottom. There is no conversion between those two numbers without knowing the denominator, and neither page gives it.
Where this falls short: four sources is a sample of what currently ranks for benchmark queries, not a census of the category, and we counted what each page publishes rather than what its publisher knows. A vendor with no published method may have a rigorous one internally. What the check establishes is that a reader cannot verify any of these numbers, which is the only thing that matters when you are about to set a target with one.
If you would rather set targets from your own baseline than from somebody’s undisclosed sample, book a growth audit and we will build the baseline with you.
Why the benchmarks cannot agree, and probably never will
This is not carelessness. Three structural reasons make a universal GEO benchmark close to impossible.
- The prompt set decides the answer. Share of voice is your share of mentions across the prompts someone chose to run. Change the prompt set and the number changes. No two publishers use the same one, and none of the four publishes theirs.
- Category structure dominates. In a category with three incumbents, a 30% share is ordinary. In one with forty players, 10% may lead. Averaging across categories produces a number that describes none of them.
- Engines disagree with each other and with themselves. The same question returns different answers on different engines and on different runs, so a benchmark that does not state its engine mix and its run count is reporting one sample as if it were the population.
Our own visibility, citability and retrievability framework sets out why these three levers behave differently across engines in the first place.
The practical consequence is not despair. It is that the second and third reference points, relative and self-referenced, are not consolation prizes. They are better instruments, because the measurement error that makes absolute benchmarks useless mostly cancels when you compare like with like.
How we weight KPI selection
Five criteria, fixed before we looked at any metric. They are our priorities, not measured coefficients.
| Criterion | Weight | What it means |
|---|---|---|
| A target can be set defensibly | 30 | You can state a threshold and say where it came from, without borrowing an unverifiable industry average |
| It changes a named action | 25 | A specific person does a specific thing when it moves past the threshold, and you can name all three |
| It survives measurement noise | 20 | The movement you would act on is larger than the run to run variation in the measurement itself |
| It is comparable to competitors | 15 | You can compute the same number for named rivals on the same prompt set on the same day |
| It connects to revenue in two steps or fewer | 10 | You can explain the path from this number to pipeline without a diagram |
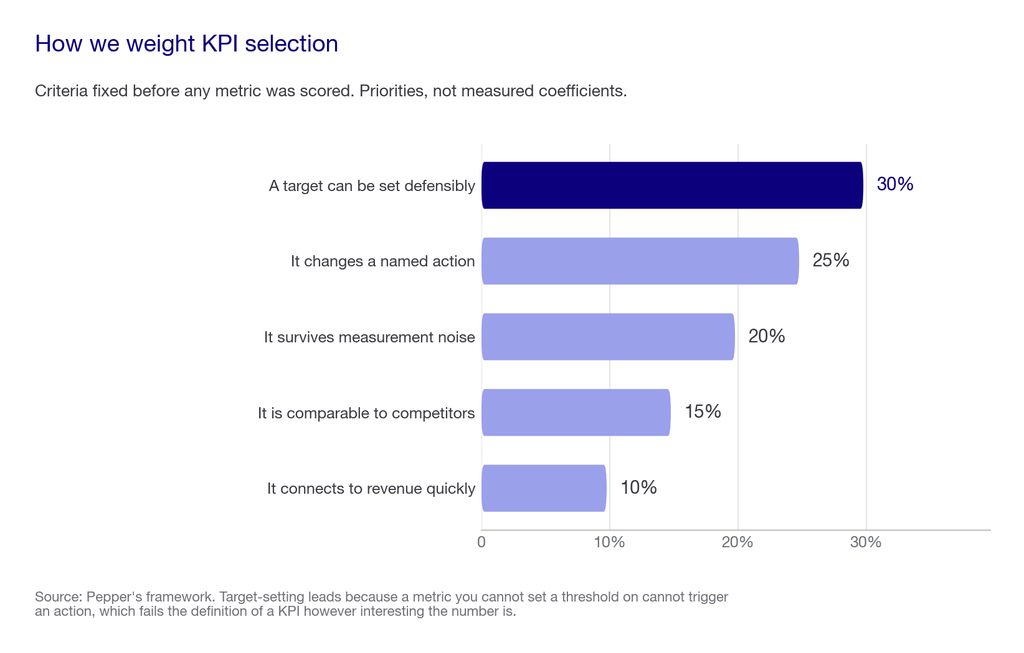
Why target-setting leads. Every other criterion describes a good metric. This one describes whether the metric can function as a KPI at all. A number you cannot set a threshold on cannot trigger an action, which means it fails the definition regardless of how interesting it is.
Where this falls short: these criteria are deliberately biased toward what a team can operate rather than toward what is most scientifically informative. A metric that fails on all five can still be the most revealing thing in your dataset. It just should not be on the board slide.
Which GEO KPIs survive
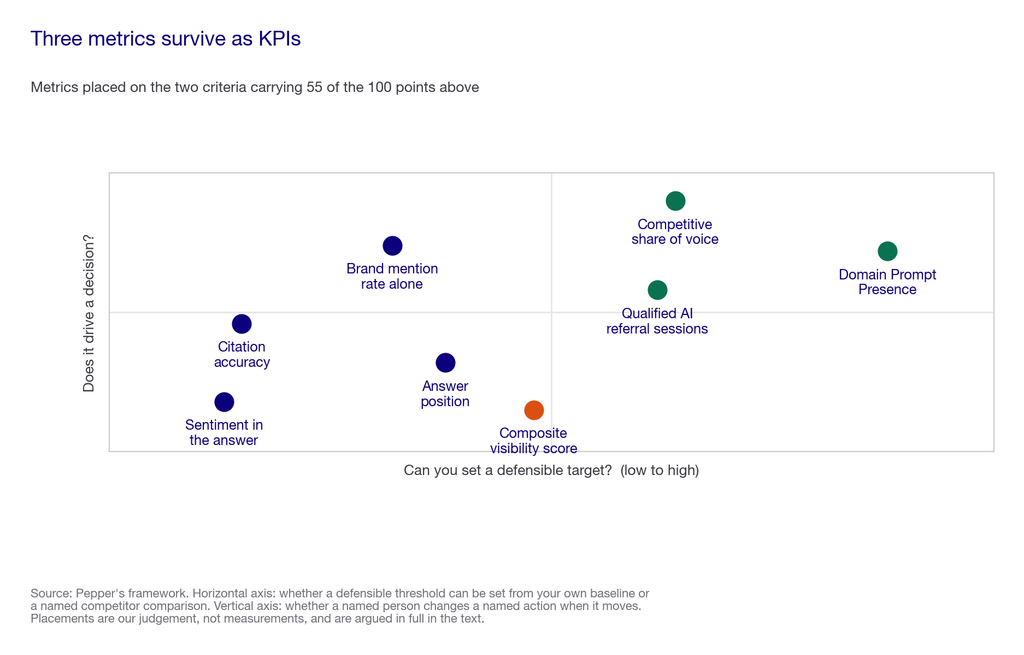
Three survive as KPIs. The rest are diagnostics, and being a diagnostic is not an insult.
1. Competitive share of voice, measured on your own prompt set
- What it measures. Your share of all brand mentions across a frozen set of buying prompts, computed alongside the same figure for named competitors.
- How it is calculated. Mentions of you, divided by mentions of every brand in the category, across the same prompts, engines and run window. The denominator is every brand, not every answer.
- How to read it. There is no universal good number, as the section above demonstrates at length. Read it as your rank and your gap to the leader, both of which are meaningful without a benchmark.
- Why it might be falling. A competitor published something that got cited. Your prompt set drifted. An engine changed its source mix. Or you ran fewer samples this month, which is a measurement artefact rather than a change.
- Where it falls short. It says nothing about whether the mention was positive or whether it drove anything. It is a position metric, and a brand can hold share while being described badly.
2. Domain Prompt Presence, or how often a page from your domain is the cited source
- What it measures. The share of tracked prompts where an engine cites a page on your domain, as distinct from mentioning your brand name.
- How it is calculated. Prompts citing your domain, divided by prompts tracked, on a fixed set.
- How to read it. The useful reading is the gap against your brand mention rate. Mentioned often and cited rarely means engines know you and trust someone else’s page about you, which is a citability problem with a specific fix.
- Why it might be falling. Retrievability broke. A stronger source now answers the question. Your page went stale. Or the engine shifted toward aggregators, which our work on what actually matters in AI search measurement covers.
- Where it falls short. Being cited is not being recommended. A page can be cited as the source of a fact in an answer that recommends a competitor.
3. Qualified AI referral sessions
- What it measures. Sessions arriving from AI engines that match your qualification criteria, not raw AI referral volume.
- How it is calculated. AI-sourced sessions filtered by your own fit definition, then joined to pipeline in your CRM.
- How to read it. Absolute volume will be small and that is expected. Read the trend and the conversion rate rather than the count, because the count says more about category adoption than about you.
- Why it might be falling. Genuine visibility loss, a referrer classification change, or your analytics stopped recognising a new engine’s referral string. Check the third before concluding the first.
- Where it falls short. It systematically undercounts. Engines answer without sending a click, so this measures only the visible tail of your influence. Never use it alone, and never let a board treat it as the whole picture.
The diagnostics, and why they are not KPIs
Citation accuracy, sentiment, factual accuracy, answer position, cross-engine overlap, cited URL mix and branded search lift are all worth watching. Most of them fail the target test, several require manual review that makes weekly measurement impractical, and a few move for reasons entirely outside your control. Track them. Review them quarterly. Do not put a threshold on them and do not report them monthly.
GEO KPIs at a glance
| KPI or diagnostic | Status | Target type that works | Review cadence | Cost to measure |
|---|---|---|---|---|
| Competitive share of voice | KPI | Relative: rank and gap to leader | Monthly | Prompt tracking, from about $29 a month at entry tiers |
| Domain Prompt Presence | KPI | Self: trailing baseline plus a noise-clearing threshold | Monthly | Same prompt tracking spend |
| Qualified AI referral sessions | KPI | Self: trend and conversion rate | Monthly | Free, from analytics joined to CRM |
| Brand mention rate alone | Diagnostic | None defensible in isolation | Quarterly | Included in prompt tracking |
| Citation accuracy | Diagnostic | None. Manual review | Quarterly | Analyst time, not software |
| Sentiment in the answer | Diagnostic | None. Too noisy for a threshold | Quarterly | Analyst time |
| Answer position or prominence | Diagnostic | None. Varies per run | Quarterly | Included in prompt tracking |
| Any single composite visibility score | Avoid | None. Hides the method | Never | Sold as the headline feature |
The last row is deliberate. A composite score is attractive precisely because it appears to solve the benchmark problem. It does not solve it, it conceals it, by burying undisclosed weights inside one number. Our note on [one shot AI visibility scores](https://www.pepper.inc/blog/aeo-metrics-measurement-ai-visibility-score/) covers this.
How to set a target when no benchmark exists
Three methods, in the order I would try them.
1. Relative, against named competitors. Freeze a prompt set. Compute your share and each named rival’s share from the same runs. Set the target as a rank or a gap, for example “close the gap to the leader from 14 points to 8 within two quarters”. This works because whatever bias your prompt set carries, it applies to everyone in the comparison equally.
2. Self-referenced, against your own trailing baseline. Take the last four measurement periods as a baseline. Set the target as a movement larger than the variation you have observed across those periods. If your monthly readings bounce by six points with no changes shipped, a five point target is noise and a twelve point target is real.
3. Decision-referenced, working backwards from the action. Ask what number would make you change the plan, then set that as the threshold. This sounds circular and is the most honest of the three, because it makes the KPI’s purpose explicit rather than implied.
What I would not do. Take a published range and adopt it. You now know that the ranges disagree by more than the movements you are trying to detect, and that none of them tells you what was measured.
What this costs to run
- The three KPIs need one tracking subscription and an analytics join. Entry prompt tracking starts around $29 a month at the cheapest published tiers, and the analytics work is people time rather than licence cost.
- The expensive part is the manual diagnostics. Citation accuracy and factual accuracy need a human reading answers, which is why they belong on a quarterly cycle rather than a monthly one.
- Enterprise platforms that supply the evidence base start around $2,500 a month, covered in our enterprise pricing work.
- Freezing the prompt set costs nothing and is the highest-value hour in the whole programme. A drifting prompt set makes every number above uninterpretable, and it drifts by default.
- Budget for run count, not just prompt count. A metric measured once a month cannot support a monthly threshold, because you cannot separate a real move from a single unlucky sample.
How Pepper fits
Pepper is an agentic organic growth engine and an organic growth partner, and the measurement discipline above is what our growth teams run rather than a theory we published.
- Pepper’s GEO platform reports the three KPIs directly. Brand Visibility for how often engines mention you, Domain Prompt Presence for how often they cite a page from your domain, and Share of Voice for your slice of the category. The gap between the first two is the citability diagnostic, and it is the single most actionable reading in the set. See the platform.
- Agent Atlas keeps the prompt set honest. Freezing a prompt set, re-running it on schedule and flagging drift are workflows rather than someone’s calendar reminder. System agents stay fixed, user agents stay editable and versioned, and customers log in and build and run their own inside Atlas.
- A growth team works alongside yours on the part software cannot do, which is agreeing the thresholds with the person who will act on them.
- We publish no universal benchmark, which is the position this article argues for and a genuine commercial cost, because a benchmark number is an excellent lead magnet.
- Proof rather than adjectives. Acceldata went from 85 to more than 300 top three keywords with 6X organic traffic growth. More in our case studies, and the B2B SaaS practice is where this KPI set was settled.
Where Pepper fits, and where it does not. We are built for teams reporting these numbers to a board on a monthly rhythm, which is where threshold discipline pays. A team that wants a single visibility score to put in a slide is asking for the thing this article argues against, and they will be happier with a tool that sells one. We also publish no pricing, so budget discovery is a conversation rather than a page.
How to choose who reports your GEO KPIs
I would start by asking a prospective partner where their benchmark came from, because the answer tells you everything about the rest of the engagement.
The framing judgement first, anchored outside my own view. Google’s guidance on optimising for generative AI features states that optimising for generative AI search is still SEO, running on core ranking systems with no separate index, and it advises against providers guaranteeing rankings because no external party has access to those systems. Read that as a filter on anyone promising an outcome. Then hold the other half, which is that Google describes only Google, and the engines that matter most to a GEO programme publish nothing comparable.
The Pepper view on top of that is narrower. Any vendor can give you a dashboard. The question is whether they will tell you when a number moved for a reason that has nothing to do with your work.
Here is the 100 point scorecard I would run over any partner reporting these numbers, including us.
| Area | Weight | What a strong partner demonstrates |
|---|---|---|
| States where every threshold came from | 30 | Each target is traceable to your baseline, a named competitor comparison or a stated decision rule, never to an unattributed industry range |
| Publishes its own measurement method | 25 | Prompt count, engine list, run frequency and date, given without being asked, so you can judge how much a movement means |
| Separates measurement artefacts from real change | 20 | They will tell you when a number moved because the prompt set drifted or an engine changed, and they raise it before you notice |
| Freezes and versions the prompt set | 15 | The set is documented, changes are logged with dates, and the effect of any change on the trend is stated |
| Reports fewer numbers than they could | 10 | They argue for three KPIs and put the rest in an appendix, rather than proving effort with a fourteen-tile dashboard |
Then run the live test, on us as readily as on anyone else. Give any prospective partner 25 buying questions from your own category, ask them to report on them, and hold the result for 90 days before you judge it. Engines vary between runs, so a single reading proves nothing. Ask for the numbers behind the numbers. For example: “how many times was each prompt run”, “what is our share of voice against these three named competitors on the same runs”, “which of last month’s movements were larger than your measurement noise”, “what threshold would make you tell us to change the plan”.
Ask them to come back with five things. Where each threshold came from. The prompt count and run frequency behind every figure. Which movements last period were noise. Which metrics they would stop reporting. And the one number they would put in front of a board, with the reason.
A partner who answers with their own measurement noise beats one who answers with an industry benchmark. And one who cannot tell you how many times a prompt was run has not measured anything, they have sampled once and rounded up.
The weaker way to run this, and it is the common one. Buy a dashboard. Adopt its default metrics. Take a benchmark from a blog post. Report fourteen numbers monthly. Watch several move every month for reasons nobody can explain. Gradually stop trusting the whole report.
The stronger sequence. Freeze a prompt set and version it. Measure your own run to run variation before setting any threshold. Pick three KPIs that pass the named person, named threshold, named action test. Set targets relative to competitors and to your own baseline. Report the other metrics quarterly as diagnostics. The distinction matters because the first sequence produces a report nobody acts on, and the second produces three numbers that change decisions.
Red flags, each one something a provider actually says.
- An industry benchmark quoted without a sample size. You have now seen four of these contradict each other, and none of them published one.
- A single composite visibility score as the headline, with undisclosed weights inside it.
- A guarantee of citations or rankings, which Google itself advises against.
- A prompt set the vendor will not show you. If you cannot see the questions, you cannot interpret a single number derived from them.
- No stated run frequency. A prompt measured once cannot support a threshold, and most vendors do not publish this.
- Metrics reported weekly where the underlying measurement varies more than the weekly movement. That is noise on a schedule.
- A dashboard that never removes a metric. Adding is easy and free. Removing requires a point of view.
Five questions worth asking, and what a good answer sounds like.
- “Where did this target come from?” A good answer names your own baseline or a competitor comparison. A bad answer names an industry average and cannot say who measured it.
- “How many times was each prompt run this period?” A good answer is a number, volunteered. A bad answer is that the tool handles it.
- “Which of these movements is inside your measurement noise?” A good answer has computed the noise. A bad answer has not considered the question.
- “What would make you tell us to stop doing something?” A good answer names a threshold and an action. A bad answer is that it depends.
- “Which metrics would you remove from this report?” A good answer names two. A bad answer says they are all important.
If I reduce this to one principle: a number without a defensible threshold is a chart, and a chart is not a KPI. Everything else on the dashboard is decoration until someone can say what they will do when it moves.
The honest note that costs us something. Very few providers are genuinely strong at measurement discipline, content execution, technical work and earned media at once, and we would not claim uniform strength across all four either. The weakest of the four is what will cap the programme, so concentrate your evaluation there rather than on the dashboard screenshots.
What nobody should promise you
Nobody should quote you an industry benchmark for a GEO metric without a sample size, an engine list and a prompt count. Four published sets, checked this week, provide none of those, and they contradict each other by more than the movements a team would act on.
Nobody should sell a composite visibility score as a KPI. It hides its weights, which is the one thing you need to see before setting a threshold.
Nobody should promise a citation or a ranking for a fee. Google advises against providers who guarantee rankings, because no external party has access to the ranking systems.
Nobody should report a metric monthly without telling you how many times it was measured. One run is a sample, and treating it as a trend is how programmes get redirected for no reason.
Where this stops working, including for us
If you have fewer than two named competitors worth comparing against, the relative method collapses and you are left with self-referenced targets only. That is workable, and it is slower to become meaningful.
If your category has no measurable prompt demand, none of these KPIs will produce a signal, and the honest finding is that you do not need a GEO dashboard this year. Re-check next quarter.
If you cannot freeze a prompt set, because the business keeps changing what it sells, say so in the report rather than presenting a trend across a moving denominator.
Where Pepper fits and does not. We report these three KPIs and argue against publishing a universal benchmark, which costs us a lead magnet our competitors happily use. A team that wants one number for a slide is asking for something we will not sell them.
Where to go next
Start by counting how many numbers on your current dashboard pass the named person, named threshold, named action test. For most teams the answer is zero or one, and that is the finding.
Then freeze your prompt set before you do anything else. For the adjacent decisions, our companion guide to selecting AI search visibility metrics covers the fourteen candidates in full, competitive share of voice analysis covers the relative method in depth, the differences between AEO, SEO and GEO settles the terminology, and what a citation rate actually is covers the unit confusion this article found in the wild. To see where you stand today, see where you show up.
Frequently asked questions
What KPIs should you use for GEO?
Three. Competitive share of voice on your own frozen prompt set, Domain Prompt Presence, and qualified AI referral sessions. Everything else is a diagnostic worth reviewing quarterly rather than a KPI worth setting a threshold on.
What is a good AI share of voice?
There is no trustworthy universal answer. Published 2026 ranges disagree sharply: one source calls above 40% strong, another calls 15% to 25% strong. None publishes a sample size. Use your rank and your gap to the category leader instead.
How is a GEO KPI different from a GEO metric?
A metric describes how engines treat your brand. A KPI is a metric where a named person changes a named action once it crosses a stated threshold. If you cannot name all three, you have a diagnostic rather than a KPI.
Why do GEO benchmarks contradict each other?
Because the prompt set decides the answer, category structure dominates the result, and engines vary between runs. No two publishers use the same prompt set, and the four we checked publish neither their prompts nor their sample sizes.
How do you set a GEO target without a benchmark?
Three ways. Relative to named competitors measured on the same runs, self-referenced against your own trailing baseline with a threshold wider than your observed noise, or decision-referenced by asking what number would change the plan.
How often should you report GEO KPIs?
Monthly for the three KPIs, quarterly for diagnostics that need manual review. Weekly reporting is generally indefensible, because the run to run variation in most GEO measurement is larger than a week of genuine change.
Should we use a single AI visibility score?
No. A composite hides its weights, which is exactly the information you need to set a threshold. It is attractive because it appears to solve the benchmark problem, and it conceals the problem instead.
Is AI referral traffic a good GEO KPI?
Only when qualified and read as a trend. It systematically undercounts, because engines answer without sending a click, so treat it as the visible tail of your influence rather than the measure of it.
Sources and further reading
- Pepper’s own reading of four published 2026 GEO benchmark sets, all read at source on 23 September 2026. Named by date and method rather than linked, per our policy on competitors. Method: for each page we recorded the benchmark ranges given, the unit used, and whether the page published a sample size, an engine list or a prompt count. Findings: a page dated 3 June 2026 gives above 40% as strong share of voice, under 15% as a significant citation gap, and states no method at all; a page dated 28 July 2026 gives 15% to 25% as strong with top players above 35%, and declares no sample for its own figures; a page published 16 July 2026 and updated 7 September 2026 gives industry AI visibility from 79.9% down to 2.5% and states only that the data comes from its own monitoring tool; a page updated 15 January 2026 reports sector share of voice at 2.80% for Information Technology, 1.91% for Consumer Staples and 0.84% for Healthcare, and discloses no sample. Limitations: four sources is a sample of what currently ranks for benchmark queries, not a census, and we recorded what each page publishes rather than what its publisher may know internally.
- Pepper, AI search visibility metrics and KPIs: the 14 numbers that actually matter, published 14 August 2026. The companion piece on metric selection, and the source of the share of voice range quoted as ours. It reaches the same conclusion about universal benchmarks by assertion, where this article tests it.
- Google Search Central, guide to optimizing for generative AI features, page last updated 10 July 2026. Source of the position that optimising for generative AI search is still SEO, and of the advice against providers guaranteeing rankings. Applies to Google Search only.
- Microsoft, AI Performance in Bing Webmaster Tools, public preview announced 10 February 2026. First party citation data, and one of the few places a figure arrives with a stated scope. How much reflects ChatGPT rather than Copilot is an open question and we do not claim otherwise.
- Pepper, competitive AI search analysis and share of voice. The relative target-setting method in depth, and the reason a competitor comparison cancels prompt set bias.
- Pepper, what a citation rate actually measures. Referenced for the unit confusion found in the wild, where one publisher expresses citation rate as a percentage and another as a monthly count.
- All threshold-setting methods described here are ours. The three methods are stated in full so a reader can apply them without us, and the article publishes no benchmark of its own, which is the position it argues for.
Latest Blogs
AI search optimization has four cost layers and only one of them has a price you can look up. Software is published, comparable and the cheapest. Agency retainers are published by exactly two firms. Earned media, which drives most AI citations, is priced by almost nobody. And the fourth layer, doing it with your own people, turns out to have no market rate at all. A study of 3,900 SEO job listings found that just 6.3% of senior roles mention AI search, and published salary figures for the same job title differ by 76% between sources.
We re-read every published GEO agency price on 25 September 2026, fifteen days after our own benchmark first recorded them. All four held, which is worth knowing on its own because the software side of this market has been withdrawing prices all quarter. The more useful finding came from the one agency that publishes volumes alongside price. Ten blog articles at $3,000 a month and forty at $8,000 works out at $300 and $200 an article. That is a content production contract with a GEO label, and the citation evidence says content you own accounts for a small minority of AI citations.
Our own benchmark of 30 published prices already answers what GEO costs. This answers the different question, which is what you should budget and where it should go. Two numbers decide it. A study of more than 25 million cited links found earned media drives 84% of AI citations while paid and advertorial content drives 0.3%. And the Gartner CMO survey of 401 CMOs puts marketing at 7.8% of revenue with SEO the largest single line inside owned and earned digital. Put those together and the answer is that GEO is not a new budget line at all. It is a reallocation, and most teams are making it in the wrong direction.
Get your hands on the latest news!