How to run an SEO growth audit in 2026: framework and checklist
The short answer
An SEO growth audit asks whether your organic programme produces growth. A site audit asks whether your website passes a crawler’s tests. The growth version runs across four systems: demand, retrievability, conversion and compounding. Price every finding before it reaches a roadmap, using reach, effect, confidence and effort. The checklist runs to 28 checks. Week one covers the conversion path, not the crawl.
Key takeaways
- We measured the competition rather than describing it. Seven SEO audit guides currently ranking for this topic, read on 22 September 2026. Published check counts run from 5 to 98.
- Not one of the seven prices a finding. Zero attach a quantified impact estimate to any individual check. Prioritisation is done with adjectives such as “high impact, low effort”.
- Not one states what its own checklist costs to run. Half an hour a check turns the 98 check guide into more than a working week of labour. No guide says so.
- Not one treats revenue or pipeline as an audit output. Conversions appear as a metric to glance at, never as the thing the audit is for.
- So the fix is not a longer checklist. It is a screen that prices findings. Reach times effect times confidence, divided by effort, against a threshold your own release capacity sets.
- Start with the conversion path, not the crawl. The crawl produces the most findings and the fewest decisions. That is precisely why it is the wrong place to begin.
- Pepper is an agentic organic growth engine and an organic growth partner. Agent Atlas puts the agents in your team’s hands. Pepper’s GEO platform reports Brand Visibility, Domain Prompt Presence and Share of Voice. A growth team works alongside yours. Eight years, more than 250 enterprises, more than 10 million tracked prompts.
A note on where this comes from. I look at organic through a revenue lens. The sentence I say most often in client reviews is that traffic moved and pipeline did not. An audit that cannot tell you which findings would have changed the second number is a maintenance document. Pepper runs organic for more than 250 enterprises over eight years and tracks more than 10 million prompts across every major engine. The audits we inherit are almost always complete and almost never prioritised.
Disclosure: Pepper sells a platform and a growth service in this category, and we published this framework. We name the seven guides we measured but do not link them, because several are direct competitors. Every count came from that guide’s own page on 22 September 2026. We state the method below so you can repeat it. Where a guide publishes no definitive count, we say so rather than estimating one.
What is an SEO growth audit, and how is it different from a site audit?
An SEO growth audit assesses whether the organic programme produces commercial growth. It organises around the systems that create growth rather than the surfaces a crawler can see.
A site audit asks a different question. It asks whether the website conforms, and it answers with a list of defects. That is genuinely useful work, and our own enterprise audit framework runs 47 technical checks for exactly that purpose. But conformance and growth are not the same thing, and a site can pass almost every check while producing nothing.
The difference shows up in three places.
- What gets audited. A site audit covers the site. A growth audit covers demand, retrievability, conversion and compounding, and only one of those four is on your domain.
- What a finding is. A site audit’s finding is a defect. A growth audit’s finding is a priced opportunity, with the number attached and the assumptions written down.
- What the output is. A site audit outputs a list. A growth audit outputs a sequenced roadmap with a threshold underneath it. Everything below that line is explicitly not happening, rather than quietly ignored.
The third difference is the one that matters most in practice. Every audit produces more findings than any team can ship. A list that will not say which ones to drop has moved the hard decision to the reader.
What seven published audit guides do not tell you
We read seven SEO audit guides currently ranking for this topic on 22 September 2026 and counted three things: how many checks each publishes, whether any check carries a quantified impact estimate, and whether revenue appears as an output.
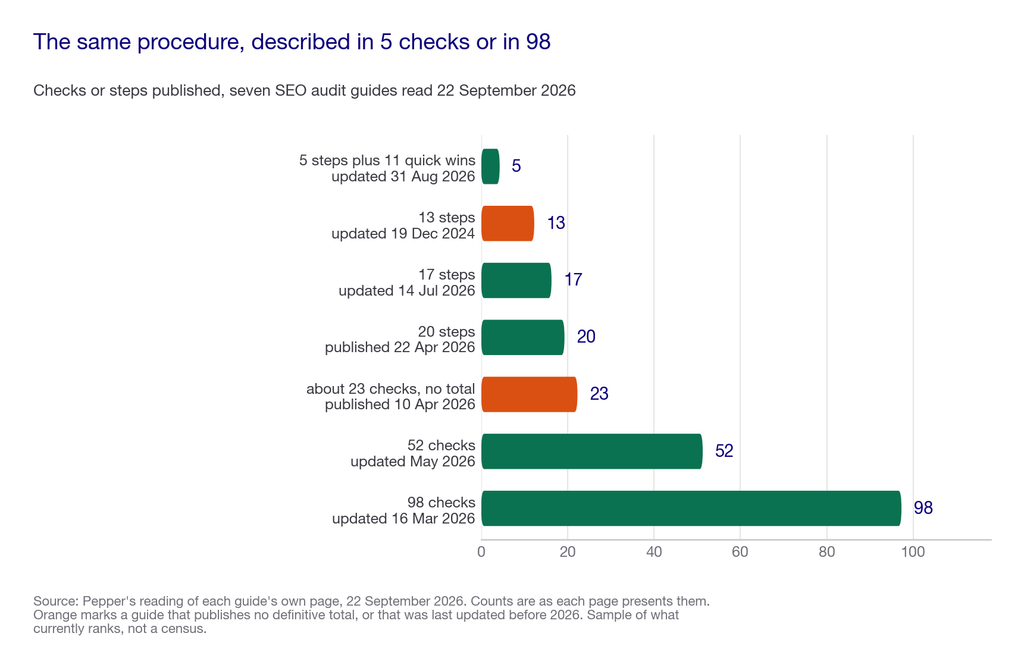
The spread is the first finding. Seven guides describe the same procedure in anything from 5 to 98 checks, close to a twentyfold difference. Two publish no definitive count at all. We recorded the count we could verify rather than inventing a tidier one.
- 98 checks, structured as seven phases of fourteen, on a guide last updated 16 March 2026.
- 52 checks, split across technical, on page, answer engine and generative engine, published March 2026 and updated May 2026.
- 20 steps, on a guide published 22 April 2026 by a major SEO platform.
- 17 steps, updated 14 July 2026.
- 13 steps, on a guide from a major SEO platform. Last updated 19 December 2024, and still ranking for a 2026 query.
- Roughly 23 checks in the quick reference of a guide published 10 April 2026, which does not publish a total.
- 5 steps plus about 11 quick wins, updated 31 August 2026. The shortest of the seven, and the only one that opens on business goals.
Then the three absences, which matter more than the spread.
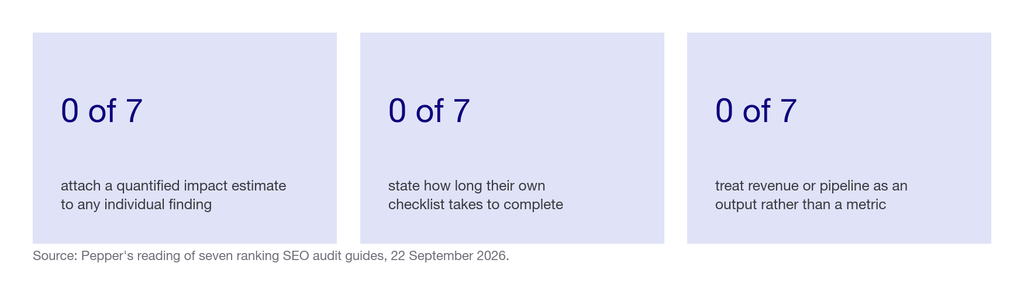
None of the seven attaches a quantified impact estimate to an individual finding. Not an estimated traffic change, not a revenue figure, not a numeric weight. Prioritisation, where it appears at all, is done in adjectives. One guide offers “high impact, low effort” as a category. Another suggests getting a page speed score “to the mid-80s”. Two include impressive numbers, but both are results from a completed engagement rather than an estimate attached to a check.
None states how long its own checklist takes. This is the quietly expensive one. At half an hour a check, the 98 check guide costs more than a full working week of analyst time before anyone scopes a single fix. The reader never learns that. You cannot compare two audit methods when neither costs its own labour.
None treats revenue or pipeline as an output. Conversions appear in six of the seven, always as a metric to review inside an analytics tool. One guide comes close and names conversions among the things a fix unblocks. It still puts no number against any of them.
Where this falls short: seven guides is a sample of what currently ranks, not a census. We counted what each page publishes, not what its author knows. A guide that omits a quantified estimate may well supply one in a client engagement. The count establishes what a reader can get from the public page, which is all a reader can get.
If you would rather see which of your own findings are worth engineering time than read another checklist, book a growth audit and we will price them with you.
How we evaluated the four systems
The framework weights four systems. We fixed the weights before running any audit. They record our judgement about where growth is won and lost, not a measurement.
| System | Weight | Why it sits here |
|---|---|---|
| Conversion path | 30 | It is the only system whose failure makes every other fix worthless, and it is the one no published guide audits |
| Demand and presence | 25 | A perfectly retrievable site in a category nobody asks about produces nothing, and this is the system that tells you which one you are in |
| Retrievability | 25 | It gates everything downstream, and a single defect here can zero out an otherwise healthy programme |
| Compounding | 20 | It decides whether next year’s audit finds the same list again, weighted lowest only because its effects land later |
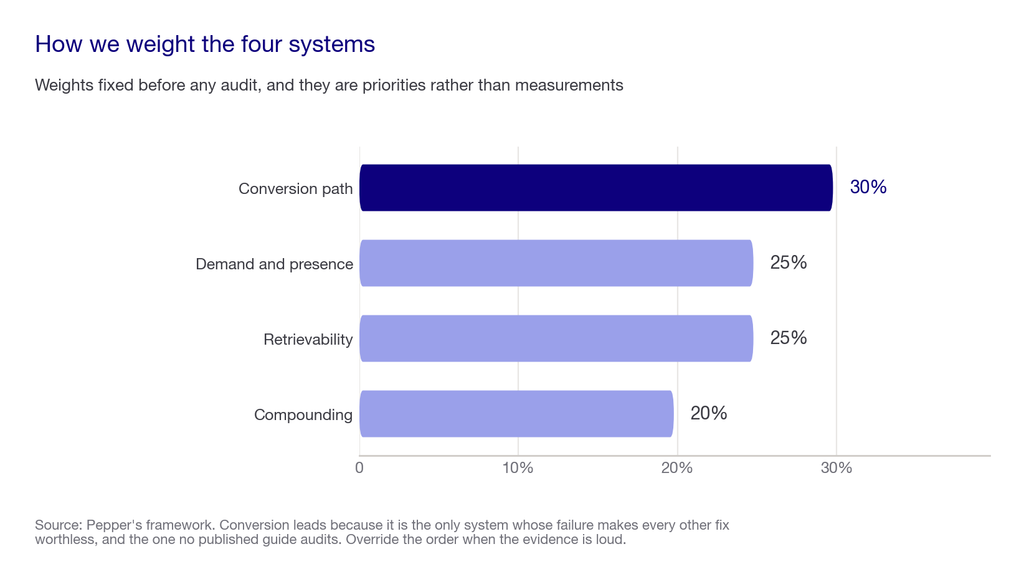
Why conversion leads. Put a fix through each of the other three and it still has to survive the conversion path to become revenue. Put a fix through conversion and it lifts everything already arriving. That asymmetry is the whole argument for auditing it first.
Where this falls short: these weights are priorities rather than measured coefficients, and a business with a genuinely broken crawl has a retrievability problem that outranks everything regardless of what the table says. Treat the weighting as a default running order, and override it when the evidence is loud.
The four systems
System 1: demand, or is anyone asking?
This system audits the market rather than your site, which is why almost no site audit contains it.
- The question: does commercial demand exist in this category, where is it expressed, and do we appear where it is expressed?
- The evidence: Search Console query data, your own tracked prompt set across engines, and the questions your sales team is actually asked.
- What good looks like: a written list of the commercial questions buyers ask, with your presence against each one recorded on more than one engine.
- The common failure: a keyword list inherited from an agency three years ago, never reconciled against what buyers now ask, and never extended to prompts.
- Where it falls short: demand data is noisy, engines answer the same question differently on different runs, and one run establishes nothing. Our work on what actually matters in AI search measurement covers the sampling problem properly.
System 2: retrievability, or can they get it?
This is the technical layer, and it is the one every published guide covers well, so this framework covers it briefly and points you at the depth.
- The question: can crawlers and engines reach, render, index and lift your content?
- The evidence: server logs first, Search Console second, a third party crawler third. Logs are the only source that tells you what actually happened rather than what a tool simulated.
- What good looks like: the templates that carry your revenue are crawled often, render without JavaScript dependencies, and are reachable by the AI crawlers you have decided to allow.
- The common failure: a crawler export treated as an audit. A crawl tells you what a crawler found, which is not the same as what Google or an engine did.
- Where it falls short: Google publishes real thresholds in its crawl budget documentation, and no other engine publishes an equivalent, so your logs are the only cross engine truth available. Full depth in our enterprise audit framework and its 47 technical checks and our guide to whether AI bots can crawl your site.
System 3: conversion, or does it become pipeline?
This is the system the category skips, and it is weighted highest here for that reason.
- The question: does organic traffic turn into pipeline, and which templates convert at a rate worth defending?
- The evidence: your CRM joined to your landing page data. Not analytics alone, because analytics tells you about sessions and the question is about revenue.
- What good looks like: a conversion rate per template, a known value per conversion, and a named owner for the pages that carry both.
- The common failure: the highest traffic template converts at close to zero and nobody has looked, so the audit’s top recommendation is to send more traffic to it.
- Where it falls short: attribution is genuinely hard, organic assists purchases it never gets credit for, and a long enterprise cycle can outrun your measurement window. The honest move is to state your attribution model in the audit rather than pretend the number is exact.
System 4: compounding, or does it get better?
- The question: does this quarter’s work make next quarter’s work easier, or are you replacing decayed output with fresh output at the same cost?
- The evidence: the decay curve of pages published twelve and twenty four months ago, your refresh cadence, and how internal link equity moves toward the pages that matter.
- What good looks like: an ageing profile where older pages hold or grow, and a refresh programme sized against the decay rate rather than against a content calendar.
- The common failure: publishing volume held constant while the back catalogue is never touched, which produces a programme that runs to stand still.
- Where it falls short: algorithm updates and category seasonality both muddy decay, so a single cohort proves little. You need two or three publishing cohorts before the shape is trustworthy.
The expected value screen, or how to price a finding
Here is the part no published guide supplies, and it is arithmetic rather than a secret.
For each finding, estimate four things and write them down.
- Reach. How many URLs or sessions the finding touches. This is countable from data you already own, so it is the one input you should not guess.
- Effect. What the fix moves, and by how much, expressed as a range rather than a point. If you cannot name the metric, you do not have a finding, you have an observation.
- Confidence. Your honest probability the fix produces the effect, between zero and one. Write the number even though it is a judgement. You can argue with a written guess. You cannot argue with an unwritten one.
- Effort. Engineering days, asked of the people who would do the work rather than estimated on their behalf.
Then compute reach times effect times confidence, divided by effort. That gives you value per engineering day, which is the only unit in which two unrelated findings can be compared.
A worked example, with illustrative inputs rather than our data. Suppose a template fix touches 4,000 URLs carrying 20,000 sessions a quarter. You estimate it lifts conversion on those pages from 0.8% to 1.1%. You are 50% confident. A conversion is worth $400, and engineering says six days. Expected quarterly value is 20,000 times 0.003 times 0.5 times $400, which is $12,000, or $2,000 per engineering day. A schema fix on nine pages with a smaller effect and the same six days lands orders of magnitude lower. Both are real findings. Only one clears a threshold.
Then set the threshold from your own capacity. Say your team ships forty engineering days of SEO work a quarter. Rank every finding by value per day, then draw the line at forty days. Everything below it goes into a named and visible backlog. The point is not the precision of the estimates. The point is that the estimates exist, are comparable, and make the decision to drop something explicit instead of accidental.
Where this falls short, and it costs us something to say it: confidence is a guess. A motivated auditor can nudge a finding above the line. The model does not remove judgement, it exposes it. Its value is that you can argue with a written assumption in a room. Run the same screen next quarter and you find out whether your estimates were any good. Treat the first quarter’s numbers as a baseline for calibration rather than as predictions.
The SEO growth audit checklist
Twenty eight checks, seven per system, each with the evidence source that settles it. This is deliberately shorter than most published checklists, because every check here has to earn a decision.
System 1, demand. Seven checks.
| # | Check | Evidence source |
|---|---|---|
| 1 | A written list of the commercial questions buyers ask exists and is under a year old | Sales calls, Search Console queries |
| 2 | Reconcile that list against what Search Console shows people actually searching | Search Console |
| 3 | Run the same list as prompts across more than one engine | Your tracked prompt set |
| 4 | Record presence per question, per engine, with a run count attached | Prompt tracking |
| 5 | Record competitor presence against the same questions | Prompt tracking |
| 6 | Map the questions to funnel stage, keeping commercial and informational apart | Your own mapping |
| 7 | Record a category with no demand as exactly that, rather than leaving it blank | The audit document |
System 2, retrievability. Seven checks.
| # | Check | Evidence source |
|---|---|---|
| 8 | Read server logs for the period audited, not just a crawler export | Server logs |
| 9 | State the crawl frequency of every revenue carrying template | Server logs |
| 10 | Know indexation status per template, not just for the site total | Search Console |
| 11 | Pages render without requiring JavaScript for their primary content | Rendering test |
| 12 | AI crawler access is a decision that someone made, not a default | robots.txt, logs |
| 13 | Structured data validates on the templates that carry the programme | Validation tooling |
| 14 | Internal links reach the pages that matter within three clicks of a hub | Crawl |
System 3, conversion. Seven checks.
| # | Check | Evidence source |
|---|---|---|
| 15 | Know conversion rate per template, not only site wide | CRM joined to page data |
| 16 | A value per conversion exists and someone in finance agrees with it | CRM, finance |
| 17 | Check the highest traffic template against its own conversion rate | CRM, analytics |
| 18 | Write the attribution model into the audit itself | The audit document |
| 19 | Surface organic assisted conversions, not only last click | CRM |
| 20 | Each converting template has a named owner | Your org chart |
| 21 | Test forms, gates and page speed on converting templates this quarter | Direct testing |
System 4, compounding. Seven checks.
| # | Check | Evidence source |
|---|---|---|
| 22 | Plot a decay curve for pages published twelve and twenty four months ago | Search Console |
| 23 | Size refresh cadence against that decay rate | Your content plan |
| 24 | The back catalogue has an owner and a budget, not only the new pipeline | Your content plan |
| 25 | Route internal link equity deliberately toward priority pages | Crawl |
| 26 | Give every page that has never earned a click an explicit decision | Search Console |
| 27 | Maintain the prompt set on a schedule rather than setting it once | Prompt tracking |
| 28 | Give every finding from last quarter a shipped or dropped status | Your roadmap |
Check 28 is the one people skip, and it is the one that turns an audit into a programme.
The four systems at a glance
| System | Weight | What it audits | Evidence you need | Cost to run |
|---|---|---|---|---|
| Demand | 25 | Whether commercial demand exists and whether you appear where it is expressed | Search Console, a tracked prompt set, sales calls | Free for search data. Prompt tracking from about $29 a month |
| Retrievability | 25 | Whether crawlers and engines can reach, render, index and lift your pages | Server logs, Search Console, a crawler | Free to about $200 a month for a crawler licence |
| Conversion | 30 | Whether organic traffic becomes pipeline, and which templates are worth defending | CRM joined to landing page data, a value per conversion | Free. The cost is access, not tooling |
| Compounding | 20 | Whether the programme improves each quarter or replaces decay at the same cost | Search Console cohorts, your content plan, last quarter’s roadmap | Free |
| All four, internally | 100 | The full growth audit | All of the above | About four weeks of one analyst |
| All four, bought in | 100 | The full growth audit, delivered | The provider asks you for the same evidence | Rarely published. Two of the agencies we surveyed publish an audit price |
The cost column is the reason most teams should run week one themselves before commissioning anything. Three of the four systems need access rather than software.
How to run it, week by week
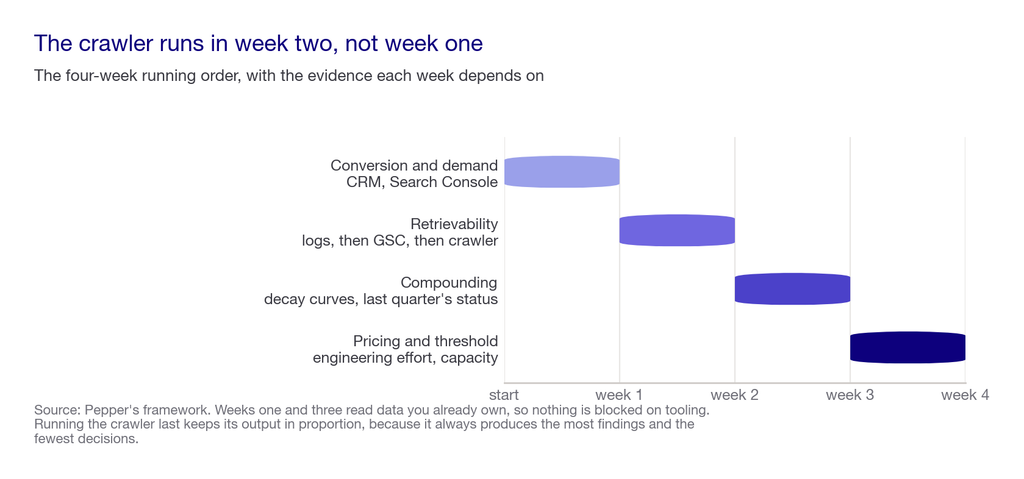
Week 1, conversion and demand. Both read from data you already own, so nothing is blocked on tooling. It also means that when the technical findings land in week two, you already know which templates are worth defending.
Week 2, retrievability. Logs first, then Search Console, then the crawler. Running the crawler last keeps its output in proportion. It will always produce more findings than anything else in the audit, and almost none of them will be the most valuable one.
Week 3, compounding. Plot the decay curves, review the refresh programme, and check last quarter’s findings for shipped or dropped status.
Week 4, pricing. Take every finding from the first three weeks through the expected value screen. Ask engineering for effort rather than estimating it. Set the threshold from capacity, then publish the list of what sits below the line.
Why the inversion matters. Most audits begin with a crawl because the crawl is the easiest thing to start. It also produces the most findings and the fewest decisions. So an audit that starts there spends week one generating work it will later have to prioritise away.
What an SEO growth audit costs
- Run internally, the cost is about four weeks of one analyst plus a few hours each from engineering, finance and sales. Every tool required is one most teams already pay for.
- Bought as a standalone engagement, published prices are unreliable. Our survey of SEO audit agencies found only two of those we checked publish a standalone audit price at all.
- Enterprise platforms that supply the evidence base start around $2,500 a month, which is a separate budget line covered in our enterprise pricing work.
- The free layer covers more of system two than people expect. Search Console and Bing Webmaster Tools together answer most retrievability questions at no cost. Google’s own documentation on impressions and clicks explains how it counts AI Mode appearances.
- The expensive part is not the audit, it is the engineering days afterwards, which is exactly why the threshold matters more than the checklist.
How Pepper fits
Pepper is an agentic organic growth engine and an organic growth partner, and this framework is the one our growth teams run on accounts we take over.
- Agent Atlas turns the repeatable parts into agents your team owns. Prompt set maintenance, decay monitoring and the quarterly re-run of check 28 are workflows rather than heroics. System agents stay fixed, user agents stay editable and versioned, and customers log in and build and run their own inside Atlas.
- Pepper’s GEO platform supplies the demand system’s evidence. Brand Visibility for how often engines mention you, Domain Prompt Presence for how often they cite a page from your domain, and Share of Voice for your slice of the category. The gap between the first two is the citability diagnostic, which sits inside our visibility, citability and retrievability framework. See the platform.
- A growth team works alongside yours. That is the part that makes the conversion system auditable at all, because the work needs someone who will sit with your revenue operations team.
- Proof rather than adjectives. Acceldata went from 85 to more than 300 top three keywords with 6X organic traffic growth. More in our case studies, and the B2B SaaS practice is where most of this framework was refined.
Where Pepper fits, and where it does not. We are built for teams running organic as a continuing function. The quarterly re-run and the calibration of last quarter’s estimates are the parts we are for. A specialist audit shop suits a business that wants one technical audit and nothing further, and our survey of that market names who publishes a price. We do not publish pricing, so budget discovery here is a conversation rather than a page.
How to choose who runs your SEO growth audit
I would start by deciding whether you are buying findings or buying decisions, because the market sells the first and almost nobody sells the second.
The framing judgement first, anchored outside my own opinion. Google’s own AI search optimisation guidance states that optimising for generative AI search is still SEO. It also advises against any provider guaranteeing rankings, because no external party has access to the ranking systems. Read that as permission to stop buying a separate AI audit, and as a filter on anyone who promises an outcome. Then hold the other half of it: Google describes Google, and no other engine publishes equivalent documentation, so an auditor who only cites Google has audited one engine.
The Pepper view on top of that is narrower. An audit’s quality is not in the number of findings. It is in the number of findings the auditor is willing to take off the list, and in whether they will tell you why.
Here is the 100 point scorecard I would run over any audit provider, including us.
| Area | Weight | What a strong provider demonstrates |
|---|---|---|
| Findings arrive priced | 30 | Every finding carries reach, an effect estimate with a range, a stated confidence and an effort figure obtained from your engineers rather than assumed |
| Evidence base is first party | 25 | Conclusions rest on your server logs, Search Console and CRM, and the provider says which URLs and which date range the sample actually covers |
| The conversion path is in scope | 20 | They ask for CRM access in week one and can name a conversion rate per template by the end of the audit, rather than treating revenue as out of scope |
| A threshold is set and published | 15 | The deliverable names what is not being done and why, sized against your real release capacity rather than an idealised one |
| Re-run and calibration included | 10 | The engagement includes checking, next quarter, whether the confidence estimates were any good, and adjusting them |
Then run the live test, on us as readily as on anyone else.Give any prospective auditor 25 commercial questions drawn from your own category, plus four weeks of your own Search Console export. Ask for findings that carry numbers, then hold the shortlist for 90 days and check what actually shipped. Engines and rankings both move, so a single reading proves nothing. For example: “which template wastes the most crawl budget and what is that worth”, “what is our conversion rate on the highest traffic template”, “which three findings would you drop first if we only had twenty engineering days”, “what did you assume, and what would change your mind”.
Ask them to answer five things. Which findings you should not act on. What each surviving finding is worth per engineering day. Which evidence source settled each one. What they would need from your team that they cannot get themselves. And what they would check first next quarter to find out whether they were right.
A provider who answers with a prioritised short list and their assumptions written down beats one who answers with a longer export, every time. And one who cannot produce a conversion rate per template has audited a website rather than a business.
The weaker way to run this, and it is the common one. Buy a crawl. Receive several hundred findings sorted by the crawler’s own severity flag. Hand the list to engineering. Watch engineering ship the cheap items at the bottom because they are the only ones that fit in a sprint. Re-run the crawl next year and receive a similar list.
The stronger sequence. Establish demand and conversion evidence before touching the crawler. Read logs before reading tools. Price every finding in a comparable unit. Set a threshold against real capacity. Publish what is below the line. Re-run the screen next quarter and check whether the confidence estimates held. The distinction matters because the first sequence optimises for finding things and the second optimises for shipping the right things, and only one of those shows up in a revenue number.
Red flags, each one a thing a provider actually says.
- A guaranteed ranking, citation or traffic outcome, which Google itself advises against, because no third party has access to the ranking systems.
- A finding count used as a selling point. “Our audit covers 300 checks” describes the auditor’s labour, not your opportunity.
- A crawler export presented as the deliverable, with the crawler’s own severity scale left as the prioritisation.
- Revenue declared out of scope on the grounds that the audit is technical. That is a real boundary, and it means you are buying a site audit, so pay site audit prices.
- A single composite site health score with no published method, which hides every trade off inside one number. Our note on one shot visibility scores applies here too.
- No willingness to name what they would drop. An auditor who says every finding matters has not prioritised, and has handed you the hard part.
- Effort estimated by the auditor rather than asked of the people who would do the work.
Five questions worth asking, and what a good answer sounds like.
- “What would you take off the list first?” A good answer names three findings and the reason each is below the threshold. A bad one says it depends on your goals.
- “What is this finding worth per engineering day?” A good answer gives a number with its assumptions attached and volunteers the range. A bad one reaches for high, medium or low.
- “Which evidence source settled this?” A good answer distinguishes logs from Search Console from a crawler, and says which URLs the sample covered. A bad one says the tool flagged it.
- “Will you ask our engineers for effort estimates?” A good answer treats this as obvious. A bad one has already filled that column in.
- “How will we know next quarter whether you were right?” A good answer describes the re-run and offers to be measured on it. A bad one describes a reporting dashboard.
If I reduce this to one principle: an audit is only as good as the things it is willing to tell you not to do. Everything else on the deliverable is findable with a crawler licence.
The honest note that costs us something. Very few providers are genuinely strong across technical evidence, content execution, digital PR and revenue analytics at once, and we would not claim to be uniformly strong across all four either. That is exactly where your evaluation should concentrate, because the weakest of the four is the one that will cap the programme.
What nobody should promise you
Nobody should promise a ranking, a citation or a traffic figure in exchange for a fee. Google advises against providers who guarantee rankings, because no external party has access to the ranking systems.
Nobody should sell an audit by its check count. A longer list is cheaper to produce and more expensive to act on. The seven guides we measured show how little the number means when it ranges from 5 to 98 for the same procedure.
Nobody should hand over findings without a unit of value attached. If the deliverable cannot be sorted into an order, the prioritisation has been left to whoever reads it last.
Nobody should call revenue out of scope and still call it a growth audit. Those are two different products at two different prices.
Where this stops working, including for us
If your organic programme is under six months old, there is no decay curve to plot and no quarter to calibrate against, so run systems one to three and come back to compounding later.
If you cannot get CRM access, be honest in the document that system three is unaudited rather than filling it with analytics proxies. An audit with a stated hole is more useful than one with a confident guess in it.
If your category has no measurable demand, you do not need this audit at all, and the honest finding is that nobody should have commissioned it. A provider willing to tell you that is worth keeping.
Where Pepper fits and does not. This framework assumes organic is a continuing function with a quarterly rhythm, which is what we are built for. A one off technical audit with no follow up is a different product, and the specialist audit shops do it well. We also publish no pricing, so comparing us on cost means a conversation.
Where to go next
Decide first whether you need findings or decisions. If your last audit produced a list nobody shipped, the problem was never the checklist.
Then run week one before you commission anything. Conversion and demand evidence already sits in your own systems, and it tells you what the rest of the audit is for. For the adjacent decisions, our 47 check enterprise framework is the technical depth behind system two, the five stage GEO and AI visibility audit covers the AI specific layer, SEO audit agencies and what to pay covers buying it in, and visibility tools ranked by sampling rate covers the tooling for system one. To see where you stand today, see where you show up.
Frequently asked questions
What is an SEO growth audit?
It is an assessment of whether your organic programme produces commercial growth, organised around four systems: demand, retrievability, conversion and compounding. Unlike a site audit, it prices every finding before it reaches a roadmap and publishes what it is choosing not to do.
How is a growth audit different from a technical SEO audit?
A technical audit asks whether the website conforms and outputs a list of defects. A growth audit asks whether the programme produces revenue. Three of its four systems sit outside your domain, and every finding carries a value per engineering day.
How long does an SEO growth audit take?
About four weeks for one analyst, plus a few hours each from engineering, finance and sales. Week one covers conversion and demand, week two retrievability, week three compounding, and week four prices every finding against your release capacity.
How many checks should an SEO audit have?
There is no agreed number. The seven ranking guides we measured publish between 5 and 98 checks for the same procedure. Ours is 28, because every check has to settle a decision rather than describe a condition.
How do you prioritise SEO audit findings?
Estimate reach, effect, confidence and effort for each finding, then compute reach times effect times confidence divided by effort. That gives value per engineering day, which is the only unit in which two unrelated findings can be compared honestly.
Should an SEO audit start with a crawl?
No. The crawl produces the most findings and the fewest decisions. Start with the conversion path and demand evidence, both from data you already own. Then run the crawler in week two, against templates you already know matter.
How often should you re-run an SEO growth audit?
Quarterly, and the re-run should include checking whether last quarter’s confidence estimates were any good. That calibration step is check 28. Skip it and the programme reverts to a series of one off audits.
Can you run an SEO growth audit for free?
Mostly. Search Console, Bing Webmaster Tools, server logs and your CRM cover three of the four systems at no extra cost. The demand system needs prompt tracking across engines, which is where a paid tool or a platform usually comes in.
Sources and further reading
- Pepper’s own count of seven SEO audit guides currently ranking for this topic, all read on 22 September 2026. Named but not linked, per our policy on competitors. Method: for each page we recorded the number of checks or steps as that page presents them, whether any individual check carried a quantified impact estimate, whether the page stated the labour cost of its own checklist, and whether revenue or pipeline appeared as an output rather than as a metric to review. Counts and stated dates: 98 checks across seven phases, updated 16 March 2026; 52 checks, published 15 March 2026 and updated May 2026; 20 steps, published 22 April 2026; 17 steps, updated 14 July 2026; 13 steps, updated 19 December 2024; roughly 23 checks in a quick reference with no published total, 10 April 2026; 5 steps plus about 11 quick wins, updated 31 August 2026. Limitations: seven guides is a sample of what currently ranks, not a census, and we counted what each page publishes rather than what its author knows.
- Google Search Central, guide to optimizing for generative AI features, page last updated 10 July 2026. Source of the position that optimising for generative AI search is still SEO, and of the advice against providers guaranteeing rankings. Applies to Google Search only.
- Google Search Central, managing crawl budget for large sites. Source for the published thresholds referenced in system two. Documentation rather than research, and current until Google changes it.
- Google, Search Console Help on impressions, position and clicks, read 22 September 2026. Source for how AI Mode appearances are counted in the free first party report.
- Microsoft, AI Performance in Bing Webmaster Tools, public preview announced 10 February 2026. First party AI citation data. How much of it reflects ChatGPT rather than Copilot is an open question, and we do not claim otherwise.
- Pepper, how to run a GEO and AI visibility audit. The five stage AI specific audit that sits alongside this framework, and the source of the engine coverage caveat in system one.
- All expected value arithmetic in this article is our own. The worked example uses illustrative inputs, not Pepper data, and is labelled as such where it appears. The model’s limitation is stated in the same section: confidence is a judgement, so the screen exposes assumptions rather than removing them.
Latest Blogs
Most advice on this is inference dressed as fact. OpenAI documents exactly one thing clearly, which is access. Here is what is documented, what is inferred, and how to verify the rest for yourself.
Being named in an AI answer and having your page used as its source are different outcomes with different causes and different fixes. The gap between them is the most useful diagnostic in AI search, and most reporting collapses it into one number.
Every platform reports share of voice and almost none of them define it the same way. Here is the definition worth using, the three choices that change the number, and how to measure it yourself without buying anything.
Get your hands on the latest news!
