Best AI search visibility tools in 2026: 14 platforms ranked by data accuracy
The short answer
Data accuracy here comes down to one thing you can actually check: how many times each prompt gets sampled. Engines are probabilistic, so a prompt run once a day tells you almost nothing about a trend. Only 5 of 14 platforms publish enough to compute it. Among those, entry-tier sampling ranges from 30 to 91 responses per prompt per month.
Key takeaways
- Nobody can measure accuracy from outside, including us. So we ranked the five determinants that decide whether a platform’s numbers hold up, reading every one off the vendor’s own site.
- Sampling rate is the determinant that matters most. Rankability publishes 91 responses per prompt per month at entry, KIME 60, and Profound, Nightwatch and Writesonic 30 each. The rest publish nothing you can compute.
- One platform sells you a single sample. Writesonic’s entry tier publishes 50 prompts and 50 answers a day, which is exactly one run per prompt. At 1:1 you cannot detect run-to-run variation at all.
- Zero of the 14 disclose run-to-run variance. Every one of them reports a number that moved without telling you whether the movement exceeded noise.
- Pepper is an agentic organic growth engine and an organic growth partner. Agent Atlas runs the prompt sets as versioned agents, Pepper’s GEO platform reports Brand Visibility, Domain Prompt Presence and Share of Voice, and a growth team acts on what it finds.
A note on where this comes from. I look at measurement through whether a number survives a board meeting. That is a higher bar than looking good on a dashboard. Pepper runs organic for more than 250 enterprises over eight years and tracks more than 10 million prompts across every major engine. That shapes this, along with the vendor evaluations we sit in. So do the buyers who tell us their tool reported a change nobody could reproduce.
Disclosure: Pepper sells in this category and published this guide. So we sit in a separate section rather than ranking ourselves among the 14, and we keep ourselves out of both ranked figures. We apply the same scrutiny to ourselves, including a “where it falls short” line. We read every figure below on that vendor’s own site: eight on 10 September 2026 and six on 8 September 2026, with the date on each entry. Where a vendor publishes nothing, we say so rather than estimating.
What is data accuracy in an AI search visibility tool, and can anyone measure it?
Data accuracy here means whether a platform’s reported visibility reflects what engines actually say. Testing that properly would mean running one prompt set through every platform, capturing the raw responses independently, then comparing.
We have not done that, and neither has anyone else publishing a ranking on this.
We checked. The most methodologically honest list in this category states plainly that it “Evaluated from vendor documentation, published pricing, and independent third-party reviews rather than hands-on testing of all 20”. Elsewhere it gets summarised as a four-month accuracy test. Another list claiming tools were “tested and ranked” publishes no prompt counts, no engine list, no runs per prompt and no baseline.
So this article does the honest version. Rather than inventing accuracy scores, it ranks the 14 on the five determinants of accuracy that vendors do publish. Those decide whether the numbers can be right at all.
- Sampling rate. Responses per prompt per month. Engines are probabilistic, so one sample is an anecdote.
- Engine coverage at your tier, and how the vendor counts it.
- Prompt-set visibility, so you can see and edit what the tool asks.
- Variance disclosure, meaning whether the vendor tells you how much a number moves between identical runs.
- Cited-URL reporting, because a source list is checkable and a score is not.
If the vocabulary is new, our glossary of core AEO terms covers it, and what actually matters in AI search measurement is the argument underneath this ranking.
The finding: only 5 of 14 publish enough to compute their own sampling rate
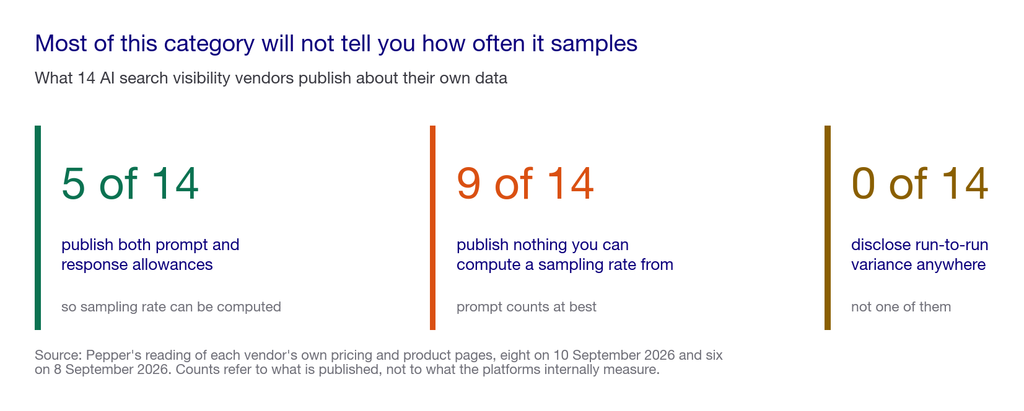
Sampling rate is simple arithmetic once a vendor publishes both numbers: monthly response allowance divided by tracked prompts. Five of the 14 publish both. Nine do not, so from outside you cannot answer the question at all for those nine.
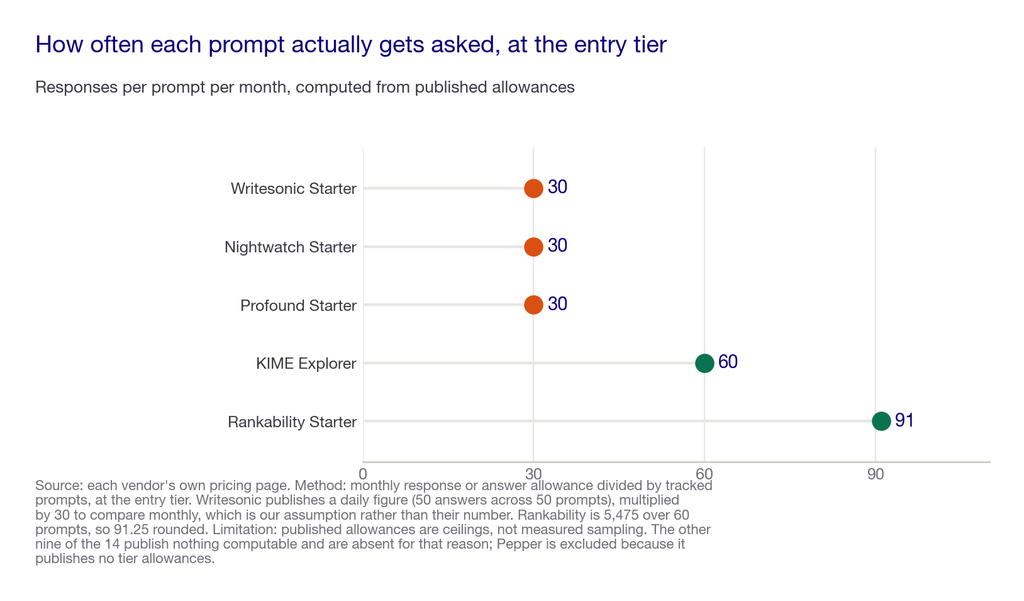
The spread matters more than the order. At 30 samples a month you get roughly one reading per prompt per day. That is enough to see a trend over weeks and not enough to trust a weekly change. At 91 you can begin to separate movement from noise.
Where this falls short: these are published allowances, not measured behaviour. A vendor could sample unevenly across prompts, or count a cached response as a sample. The allowance is a ceiling and a signal rather than a guarantee. Only a controlled test would settle it.
If you want your own prompt set sampled at a volume that supports a decision rather than a chart, book a growth audit and we will show you the raw responses behind the number.
How we scored the 14
Five criteria, and we fixed the weights before assessing any vendor. They sum to 100.
| Criterion | Weight | What a strong platform has to demonstrate |
|---|---|---|
| Sampling rate published and adequate | 35 | The vendor publishes both the prompt allowance and the response allowance, so a buyer can compute how often each prompt actually runs rather than trusting a claim |
| Cited URLs reported per prompt | 25 | The output names the exact pages an engine used, because that list is checkable against reality and a composite score is not |
| Engine coverage stated plainly at your tier | 20 | The page spells out what your tier includes, what costs extra, and how the vendor counts each surface, with no bundling that inflates the headline |
| Prompt set visible and editable | 15 | You can see every prompt being run, change it, and export it, rather than trusting a generated set you cannot inspect |
| Variance disclosed | 5 | The vendor states somewhere that repeated runs differ, and ideally shows by how much. Weighted low because nobody does it, not because it does not matter |
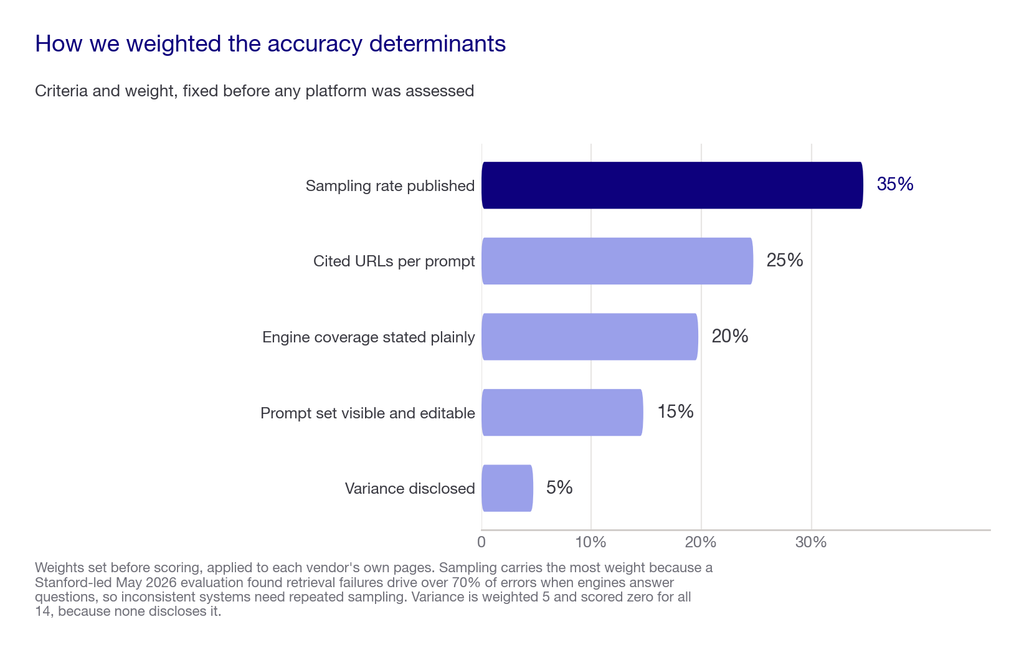
Sampling carries the most weight for a measured reason. A Stanford-led evaluation published in May 2026 found that retrieval failures drive over 70% of errors when engines answer questions, not reasoning failures. That is another way of saying these systems are inconsistent about what they fetch, and inconsistent systems need repeated sampling before a single reading means anything.
Variance disclosure carries a weight of 5 and scores zero across the board. Not one of the 14 publishes anything about run-to-run variation. We kept the criterion because you should ask, and because the first vendor to volunteer it deserves the credit.
Engine coverage is gated, and the gating is the trap
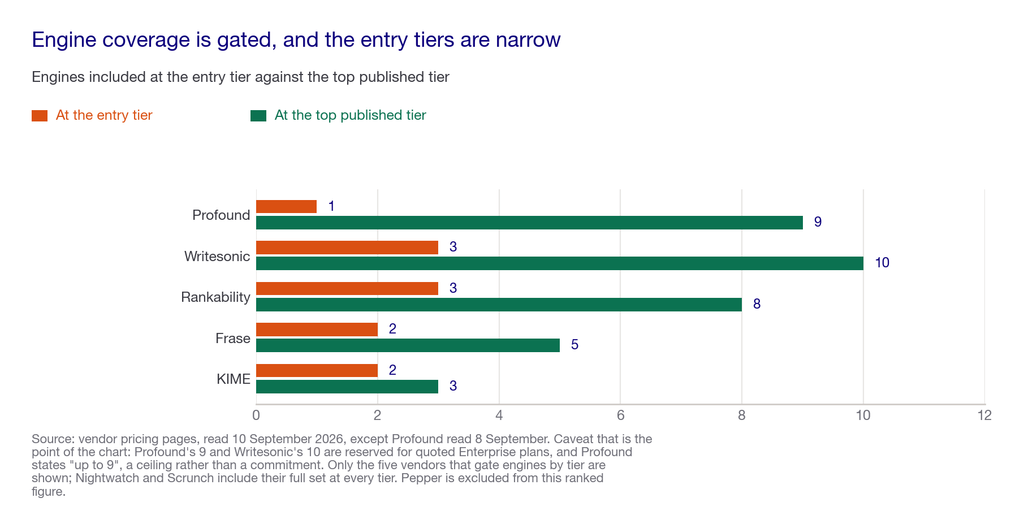
Five of the 14 gate engine coverage by tier, and the gap is wide enough to change what a tool can tell you:
- Profound covers ChatGPT only on its $99 Starter, three engines on Growth, and states “up to 9” on Enterprise.
- Writesonic covers three platforms on all standard tiers and reserves all ten for Enterprise.
- Frase steps 2, then 3, then 5 engines across $39, $103 and $239.
- KIME steps 2 then 3 engines across its two published tiers.
- Rankability steps 3, then 5, then 8 platforms across $99, $199 and $399.
The trap is buying the cheapest tier to test a cross-engine question that tier cannot answer. A $39 plan covering ChatGPT and Google AI tells you nothing about Perplexity.
The best AI search visibility tools, ranked
Named, never linked. Read on each vendor’s own site, with the date on every entry, because this category reprices and repositions constantly.
1. Rankability
Rankability publishes the highest sampling rate we could compute anywhere in the category, and publishes it plainly. Read 10 September 2026.
- What it tracks: AI search visibility plus traditional rank tracking across Google Search, Google Local, Bing, DuckDuckGo and Brave at no extra cost.
- Published price: Starter $99, Core $199, Team $399 a month, with 17% off annual.
- Prompts and responses: 60 prompts and 5,475 AI answers a month at Starter, 125 and 19,010 at Core, 250 and 60,833 at Team.
- Computed sampling rate: roughly 91, 152 and 243 responses per prompt per month by tier. The highest published in this set.
- Engines: ChatGPT, Google AI Mode and Claude at Starter, adding AI Overviews and Perplexity at Core, then Gemini, Grok and Copilot at Team.
- Where it falls short: it gates engines hard at the bottom, so the cheapest tier cannot answer a cross-engine question, and it publishes nothing about run-to-run variance.
2. KIME
KIME publishes both allowances and says explicitly why repetition matters. Almost nobody else does. Read 10 September 2026.
- What it tracks: AI visibility across engines, with daily prompt runs.
- Published price: Explorer EUR 99, Core EUR 399 a month, Enterprise quoted.
- Prompts and responses: 50 prompts and 3,000 responses a month at Explorer, 200 and 18,000 at Core.
- Computed sampling rate: roughly 60 responses per prompt per month at Explorer and 90 at Core.
- On its own page: “Because KIME runs your prompts daily, 7 days is enough to see a real baseline rather than a single snapshot.”
- Where it falls short: two engines at Explorer and three at Core is narrow for a real category. It prices in euros, so comparison needs conversion. And it ranks itself best overall on its own published list without disclosing that it publishes the list.
3. Profound
Profound publishes the clearest tier ladder in the category and states response volume, which is why we can assess it at all. Read 8 September 2026.
- What it tracks: prompt tracking with per-response detail and agent analytics, on unlimited domains at every tier.
- Published price: Starter $99, Growth $399 a month, Enterprise quoted.
- Prompts and responses: 50 prompts and 1,500 monthly responses at Starter, 100 and 9,000 at Growth.
- Computed sampling rate: roughly 30 responses per prompt per month at Starter and 90 at Growth.
- Engines: ChatGPT only at Starter, three at Growth, “up to 9” at Enterprise.
- Where it falls short: a single-engine entry tier cannot answer the cross-engine question most buyers arrive with. And “up to 9” is a ceiling rather than a commitment.
4. Nightwatch
Nightwatch publishes both allowances and holds the same sampling rate at every tier. That consistency is unusual. Read 10 September 2026.
- What it tracks: AI answer tracking alongside conventional rank tracking, daily, by location and language.
- Published price: Starter EUR 79, Professional EUR 159, Agency EUR 399 a month, Enterprise quoted.
- Prompts and responses: 50 prompts and 1,500 AI answers a month, 150 and 4,500, then 500 and 15,000.
- Computed sampling rate: roughly 30 responses per prompt per month at every published tier.
- Engines: ChatGPT, Claude, Gemini, Perplexity, AI Mode and AI Overviews on all plans, which is rare and good.
- Where it falls short: 30 samples a month is about one a day, so you cannot separate weekly movement from noise, and it prices in euros.
5. Writesonic
Writesonic publishes prompts and answers as separate numbers. That is the most useful disclosure in the category, and the most revealing. Read 10 September 2026.
- What it tracks: AI visibility inside a wider content platform, with daily tracking.
- Published price: Starter $79, Basic $199, Growth $399 a month billed annually, Enterprise quoted.
- Prompts and answers: 50 prompts and 50 answers tracked daily at Starter, 100 and 300 at Basic, 200 and 600 at Growth.
- Computed sampling rate: exactly 1 answer per prompt per day at Starter, and 3 at Basic and Growth.
- Engines: ChatGPT, Gemini and Google AI Overviews on standard tiers, with all ten reserved for Enterprise.
- Where it falls short: the entry tier samples each prompt once, so run-to-run variation is undetectable by construction. Three engines on a $399 plan is also narrow.
6. ZipTie
ZipTie is the only platform here that sells refresh frequency as an explicit purchasable dimension. Read 10 September 2026.
- What it tracks: AI visibility across seven configurable engines, on a usage-based model rather than fixed plans.
- Published price: presets described as “starting points, not plans” from $35.63, $549.67 and $2,614.34 a month, with 20% off annual.
- Sampling model: you buy prompt slots at daily, weekly or monthly refresh. On its own page: “A prompt is a slot you hold, not a meter that counts down.”
- Engines: ChatGPT, Google AI Overviews, Perplexity, Google AI Mode, Microsoft Copilot, Bing AI Overview and Google Gemini, chosen per configuration.
- Where it falls short: because you assemble the plan, nobody can compute a comparable sampling rate without configuring a quote, and the presets span a 73-fold price range that tells a buyer very little.
7. Otterly
Otterly is the cheapest published entry in the category. The sticker price is not the price of useful coverage. Read 8 September 2026.
- What it tracks: prompt tracking and link monitoring across AI search.
- Published price: Lite $29, Standard $189, Premium $489 a month, Enterprise from $1,000, with 15% off annual.
- Prompts: 15 at Lite, 100 at Standard, 400 at Premium. Extra prompts $99 per 100.
- Engines: four included, being ChatGPT, Google AI Overviews, Perplexity and Microsoft Copilot. Google AI Mode, Gemini and Claude cost extra at $9, $9 and $29 on Lite. So full coverage on the cheapest plan is $76 rather than $29.
- Where it falls short: 15 prompts is too few to read a category, it publishes no response volume so you cannot compute sampling, and the add-on model means advertised coverage is not included coverage.
8. AthenaHQ
AthenaHQ publishes the highest model count available at a published price, and a genuinely usable free tier. Read 8 September 2026.
- What it tracks: prompt and response analysis, sources and competitor insight, with its own agent.
- Published price: Essential free with $25 credit, Starter $295 a month, Enterprise quoted.
- Models: 5 on the free tier, being ChatGPT, Perplexity, AI Overviews, Gemini and Copilot. 10 on Starter, adding AI Mode, Claude, Grok, DeepSeek and Meta AI.
- Included: unlimited members on the free tier.
- Where it falls short: it publishes neither a response nor a prompt allowance, so sampling stays unknowable, and the jump from free to $295 leaves mid-sized teams with no natural tier.
9. Scrunch
Scrunch publishes a full ladder and, unusually, does not gate engines by tier at all. Read 8 September 2026.
- What it tracks: brand monitoring across engines, plus GA4 integration for AI referral traffic.
- Published price: Starter $250 annual or $300 monthly, Growth $417 or $500, Enterprise quoted, with 17% off annual.
- Engines: the same set at every tier, being ChatGPT, Claude, Gemini, Perplexity, both Google AI surfaces and Meta.
- Note on counting: that reads as six platforms or seven surfaces, depending on whether Google AI Mode and AI Overviews count separately. This is exactly the counting ambiguity the category runs on.
- Where it falls short: the highest entry price of any published ladder here, and it publishes neither allowance, so sampling stays unknowable.
10. Semrush AI Visibility
Semrush puts AI visibility inside a suite you may already own, which is its main argument. Read 8 September 2026.
- What it tracks: AI visibility alongside position tracking, audits and reporting.
- Published price: SEO $117.33, Starter $165.17, Pro+ $248.17, Advanced $455.67 a month billed annually, Enterprise quoted.
- Prompts: 50 tracked daily on Starter, 100 on Pro+, 200 on Advanced. The cheapest SEO tier includes none.
- Engines: AI Overviews, AI Mode, ChatGPT, Perplexity and Gemini.
- Where it falls short: it publishes no response volume, so you cannot compute sampling. The prompt allowance is thin for a real category, and you buy a whole suite to reach the AI features.
11. Frase
Frase publishes a clear low-cost ladder and is explicit that it does not act on what it finds. Read 10 September 2026.
- What it tracks: AI visibility monitoring with daily checks and alerts, inside a content platform.
- Published price: Starter $39, Professional $103, Scale $239 a month on annual billing, Enterprise quoted.
- Prompts: 50, 200 then 500 by tier.
- Engines: ChatGPT and Google AI at Starter, adding Perplexity at Professional, then Claude and Gemini at Scale.
- On its own page: “Daily monitoring and alerts. AI Visibility does not auto-fix.”
- Where it falls short: it publishes no response volume, so sampling stays unknowable. Two engines at the entry tier is very narrow, and it ranks itself first on its own published list of AI visibility tools.
12. SE Ranking
SE Ranking covers five AI surfaces inside an established SEO platform. Read 10 September 2026.
- What it tracks: brand mentions and links triggered by target prompts, with historical data.
- Engines: AI Overviews, AI Mode, ChatGPT, Gemini and Perplexity.
- Published price: not shown on the AI visibility page itself, which directs to separate platform and API plans.
- Prompts and responses: no maximum prompt count and no response volume stated on that page.
- Where it falls short: the least checkable entry among the established platforms. Neither price, prompt cap nor sampling appears on the product page a buyer lands on.
13. Peec AI
Peec AI names run frequency as a billing dimension, which is conceptually right. Then it publishes no numbers. Read 10 September 2026.
- What it tracks: AI search analytics for marketing teams.
- Published price: none. It lists four tiers as Starter, Pro, Advanced and Enterprise, marked annual, with no figures against any of them.
- Billing unit, in its own words: “Calculated by multiplying tracked prompts by active models and tracking frequency.”
- Prompts, engines and frequency: it publishes none of the three per tier.
- Where it falls short: it is the only platform here that names sampling frequency as part of the price and then publishes nothing you can compute, so from outside you can assess nothing about its accuracy.
14. AirOps
AirOps publishes a free tier and nothing else. It has also repriced twice inside a fortnight. Read 8 September 2026.
- What it tracks: AI search insights plus agent execution, positioned for enterprise.
- Published price: none at any paid tier. Solo is free with 35,000 monthly tasks, one brand kit, three knowledge bases and single-user access.
- Engines: ChatGPT insights only on Solo, and “7+ answer engines” on Pro, which is a floor rather than a figure.
- Volatility: its published tiers and engine list both changed within five days of our previous reading. Any comparison of it ages in days.
- Where it falls short: no paid pricing, neither allowance, and a coverage claim nobody can pin to a tier, which makes it the hardest entry here to evaluate on accuracy.
Pepper, in its own section
We are not in the ranking. Ranking ourselves among licences we do not directly compete with would be the thing this article criticises. Here is the full entry, held to the same standard.
Pepper is an agentic organic growth engine and an organic growth partner. The distinction that matters for a measurement article is that we do not stop at the number.
- Pepper’s GEO platform reports three separable things rather than one composite: Brand Visibility for how often engines mention you, Domain Prompt Presence for how often they cite a page from your domain, and Share of Voice for your slice of category mentions. The gap between the first two is the citability diagnostic. It is the fastest read on whether your constraint is authority rather than structure. See the platform.
- Agent Atlas runs the prompt sets as workflows rather than a chat box. System agents stay fixed, user agents stay editable and versioned, so you can see exactly which prompts ran and roll back a change. Customers log in and build and run their own agents in Atlas.
- A growth team comes with it, acting on what the measurement finds. Agents for scale, experts for judgement, one team on the hook for the number, which is the half a licence cannot supply.
- Coverage: six engines, including ChatGPT, Perplexity, Gemini and Google AI Overviews, run at the response volume needed to trust a reading rather than the longest possible list.
- Credentials: eight years, more than 250 enterprises, more than 10 million tracked prompts.
- Proof: Acceldata went from 85 to more than 300 top-three keywords with 6X organic traffic growth, and one hero guide carried over 260,000 impressions.
Where it falls short: we do not publish tier pricing, so budget discovery is a conversation rather than a page, and we keep ourselves out of the sampling figure above for the same reason. We are built for teams running organic as a long-term function, with an internal team to work alongside. A self-serve licence with nobody attached is not what we are for.
The 14 platforms at a glance
| # | Platform | Published entry price | Samples per prompt, month | Engines at entry |
|---|---|---|---|---|
| Own section | Pepper | Not published | Set to the volume needed to trust a reading | Six, including ChatGPT, Perplexity, Gemini and AI Overviews |
| 1 | Rankability | $99 | 91 | 3 |
| 2 | KIME | EUR 99 | 60 | 2 |
| 3 | Profound | $99 | 30 | 1 |
| 4 | Nightwatch | EUR 79 | 30 | 6 |
| 5 | Writesonic | $79 | 30 | 3 |
| 6 | ZipTie | From $35.63, usage-based | Not computable, you buy refresh slots | 7, configurable |
| 7 | Otterly | $29, or $76 with engine add-ons | Not published | 4 included |
| 8 | AthenaHQ | Free, then $295 | Not published | 5 free, 10 paid |
| 9 | Scrunch | $250 annual, $300 monthly | Not published | Full set at every tier |
| 10 | Semrush AI Visibility | $165.17 for the first AI tier | Not published | 5 |
| 11 | Frase | $39 | Not published | 2 |
| 12 | SE Ranking | Not on the AI page | Not published | 5 |
| 13 | Peec AI | Not published | Not published | Not published |
| 14 | AirOps | Free tier only | Not published | 1 free, “7+” on Pro |
Prices sit in three currencies and are never converted, which is why no figure in this article plots them on a shared axis. Pepper appears for completeness and is excluded from both ranked figures.
What these platforms cost
Published entry prices span a wide range and three currencies. Read them as orientation rather than a like-for-like table.
- Cheapest published entry: $29 a month at Otterly, though full engine coverage on that tier is $76.
- Mid-market published tiers: roughly $99 to $250 a month at Rankability, Profound, Frase, Semrush and Scrunch.
- Euro-priced ladders: Nightwatch from EUR 79 and KIME from EUR 99, which is why they are not plotted on a dollar axis anywhere in this article.
- Publishing nothing at a paid tier: Peec AI, AirOps and SE Ranking’s AI visibility page.
- Free tiers worth using first: AthenaHQ Essential with a $25 credit, AirOps Solo, and Microsoft’s own AI Performance report in Bing Webmaster Tools, which reports your Copilot citations at no cost.
Pepper does not publish pricing either, so budget discovery with us is a conversation rather than a page. What we will say plainly is that a licence is the cheap part. A tool nobody acts on is the most expensive thing in this category.
How to choose an AI search visibility tool
I would not start from a shortlist. I would start by writing the prompt set. The prompt set determines which tier you need, and the tier determines whether the tool can answer your question at all.
The framing judgement first, anchored outside our own opinion. Google’s guidance says optimising for generative AI search “is optimizing for the search experience, and thus still SEO”. It also advises against providers who guarantee rankings. Read that as a warning against buying a separate AI measurement religion. Then hold the other half: Google publishes documentation and the other engines publish nothing comparable, so cross-engine sampling is the only way to see the rest.
Here is the 100-point scorecard I would run over any vendor, ours included.
| Area | Weight | What a strong vendor should demonstrate |
|---|---|---|
| Sampling you can compute | 30 | The vendor publishes both allowances for the tier you would buy, so you can divide one by the other before you talk to anyone |
| Evidence in the output | 25 | Cited URLs per prompt per engine, exportable, because that is the only part of the report you can check against reality |
| Honesty about variance | 20 | The vendor volunteers that repeated runs differ, and will show you two runs of the same prompt on request rather than a smoothed line |
| True cost at the coverage you need | 15 | A written quote covering the engines, prompts and sampling you actually require, with add-ons itemised rather than a headline tier price |
| Prompt-set control | 10 | You can see, edit and export every running prompt, and someone can explain how they chose the starting set |
Then run the live test, on us as readily as on anyone else. Give each vendor 25 questions from your own category and ask them to run them live. Then run the identical set again the following day. For example: “best AI search visibility tools”, “which platform should we use to track ChatGPT mentions”, “what is the difference between AEO and GEO”, “alternatives to our biggest competitor”.
Ask them to come back with five things. Where does my brand appear today. Which competitors appear instead. Which sources are influencing those answers. Why are those sources winning. What exactly would you change in the next 90 days. Then compare the two days of output. A vendor whose numbers match exactly across two days is smoothing something. One who cannot explain the difference does not understand their own product.
The weaker way to buy this, and what most evaluations do: shortlist from a listicle, compare engine counts and prices in a spreadsheet, take three demos, buy the middle tier. Every step feels rigorous. None of it establishes how often your prompts will actually run, which is the number deciding whether the data means anything.
The stronger sequence: write the prompt set, then compute the sampling rate you need from how often you will act. Price only the tiers that deliver it, run two vendors on the same prompts on two different days, and compare their cited URLs. Only then compare price. It matters because sampling is the one variable no dashboard can fix later.
Red flags, each one something we have heard in a real vendor call:
- A single AI visibility score as the headline, with no prompts or cited URLs behind it.
- No published response volume, which covers nine of the 14 here, so you cannot compute sampling before buying.
- A prompt set you cannot see or edit, usually described as proprietary.
- Coverage claims like “7+ engines” or “up to 9” that nobody will pin to your tier in writing.
- Silence on run-to-run variance, which covers all 14, so ask and treat a straight answer as a differentiator.
- Branded-prompt-only tracking, which makes every report look good.
- A ranking published by a vendor that appears on it, which several of these are.
- A guarantee of citations, which Google itself advises against, because no third party has access to the ranking systems.
Five questions I would ask, and what a good answer sounds like.
- “How many times will you run each of my prompts per month?” A good vendor answers with a number immediately, because it is arithmetic from your tier.
- “Run this prompt twice and show me both answers.” The right answer is two different outputs and an explanation of how they aggregate.
- “Which cited URL would you go and influence first?” This separates a measurement product from a dashboard.
- “What does this cost at the engines and sampling I actually need?” In writing, with add-ons itemised. Otterly’s $29 becoming $76 is the general case.
- “What would make you tell me not to buy this?” A vendor with no answer will sell it to you regardless of fit.
If I reduce this to one principle: buy the sampling rate, not the dashboard. A platform that asks your questions often enough to separate signal from noise earns its price. One that asks once a day is a screenshot with a subscription.
The honest closing note, and it costs us something. Very few providers here are equally strong at sampling, evidence, execution and attribution, ourselves included. The good ones will tell you which is weakest. Ask, and treat a straight answer as a positive signal.
What nobody should promise you
Nobody should promise accurate data without telling you how often they ran each prompt. That number is the claim, and nine of these 14 do not publish it.
Nobody should promise a single composite visibility score, or a universal benchmark for a good citation rate. No such benchmark exists. Your own trend against the category leader is the only useful comparison, which is why we track citation rate that way.
Nobody should promise results from one engine on one run, or clean attribution from a citation to closed revenue. We will not, and we would rather lose the deal than pretend we have solved attribution.
Where this stops working, including for us
If your category has fewer than roughly thirty distinct commercial prompts, no sampling rate saves you. Track a handful by hand, set up the free Bing citation report, and revisit in two quarters.
If nobody can act on findings inside a fortnight, you do not need any platform on this page and you do not need us. The subscription just becomes a recurring reminder of a problem nobody can fix.
Where Pepper falls short: covered in our own section above rather than buried here. We publish no tier pricing, and we are built for a long-term organic function with an internal team alongside.
Where to go next
Write the prompt set first, then divide any vendor’s monthly response allowance by it. That single sum eliminates most of this shortlist in about ten minutes.
Then set up the free Bing citation report as a baseline before you pay anyone. Want your own category read across engines first? See where you show up. Our current view of citation monitoring tools and LLM monitoring tools covers the neighbouring terms. The limits of a single composite number are in the AI visibility score.
Frequently asked questions
What are the best AI search visibility tools in 2026?
On sampling rate, the one accuracy determinant you can verify, Rankability publishes the highest at roughly 91 responses per prompt per month at entry. KIME follows at 60, then Profound, Nightwatch and Writesonic at 30 each. Nine of the 14 publish nothing computable.
How do I know if an AI visibility tool’s data is accurate?
You cannot measure accuracy from outside. Divide the published monthly response allowance by the tracked prompt count to get sampling rate. Then ask to see two runs of the same prompt, and ask for cited URLs rather than a score.
Why does sampling rate matter so much?
Because engines are probabilistic and return different answers to the same prompt. One sample a day cannot distinguish a real change from normal variation, so a tool at that rate reports movement it cannot justify.
Which AI visibility tools publish their response volume?
Five of the 14 we checked: Rankability, KIME, Profound, Nightwatch and Writesonic. The rest publish prompt counts at best, which makes sampling rate impossible to compute before you buy.
How much do AI search visibility tools cost?
Published entry tiers run from $29 a month to over $2,600, across three currencies. Check add-ons carefully. Full engine coverage on the category’s cheapest plan costs $76, not its $29 sticker price.
Do these tools cover every AI engine?
No, and vendors usually gate coverage by tier. Entry tiers range from one engine to six, and they count Google’s two AI surfaces differently, so confirm in writing exactly what your tier includes.
Can I track AI visibility for free?
Partly. Microsoft’s AI Performance report in Bing Webmaster Tools is free, showing cited URLs and triggering queries for Copilot and Bing AI summaries. AthenaHQ and AirOps also publish free tiers with limited engines.
Do any of these tools report run-to-run variance?
None of the 14 publishes anything about it, which is why the criterion carries a low weight and a zero score. Ask every vendor directly, because a straight answer is currently a real differentiator.
Sources and further reading
- Vendor pricing and product pages, read on each company’s own website. On 10 September 2026: Rankability, KIME, Nightwatch, Writesonic, ZipTie, Frase, SE Ranking and Peec AI. On 8 September 2026: Profound, Otterly, AthenaHQ, Scrunch, Semrush and AirOps. Not linked, per our policy of naming competitors without passing them authority. Every prompt count, response allowance, engine list and price in this article comes from those pages.
- Pepper’s own computation of sampling rate, 10 September 2026. Method: divide each vendor’s published monthly response or answer allowance by its published tracked-prompt count, at the entry tier. Where a vendor publishes a daily figure, we multiply by 30 to compare monthly, and we state that because it is our assumption rather than a vendor figure. Limitation: published allowances are ceilings, not measured behaviour.
- Suzgun, Shen, Bianchi, Spangher, Icard, Ho, Jurafsky and Zou, “Evaluating Commercial AI Chatbots as News Intermediaries”, arXiv:2605.22785, submitted 21 May 2026. Source of the finding that retrieval failures drive over 70% of errors, which is why sampling carries the heaviest weight. Limitation: news questions on commercial chatbots.
- Google Search Central, guide to optimizing for generative AI features, and the announcement post, 15 May 2026. Source of the “still SEO” framing and the advice against guaranteed rankings. Applies to Google Search only.
- Microsoft, AI Performance in Bing Webmaster Tools, public preview announced 10 February 2026. The free baseline named in the cost section.
- Pepper, Acceldata case study. Source of the 85 to more than 300 top-three keywords and 6X organic growth figures, verified on the page. One account, not a benchmark.
What is not here, and why. No measured accuracy scores. Ranking 14 platforms by tested accuracy would require running one prompt set through all of them and comparing against independently captured engine responses, which we have not done. Nobody publishing a ranking on this has done it either: the most transparent competing list states it evaluated from vendor documentation rather than hands-on testing, and another claiming to have tested tools publishes no prompt counts, engines or baseline. So this article ranks the determinants of accuracy instead, and says so in the title’s own terms rather than implying a benchmark exists. Six of the 14 were read on 8 September rather than 10 September, and each entry states its date.
Latest Blogs
Most advice on this is inference dressed as fact. OpenAI documents exactly one thing clearly, which is access. Here is what is documented, what is inferred, and how to verify the rest for yourself.
Being named in an AI answer and having your page used as its source are different outcomes with different causes and different fixes. The gap between them is the most useful diagnostic in AI search, and most reporting collapses it into one number.
Every platform reports share of voice and almost none of them define it the same way. Here is the definition worth using, the three choices that change the number, and how to measure it yourself without buying anything.
Get your hands on the latest news!

Similar Posts
GEO / AI Search
10 mins read
How to get cited by ChatGPT
GEO / AI Search
10 mins read
Mentioned vs cited: the difference that decides AI visibility
GEO / AI Search
13 mins read