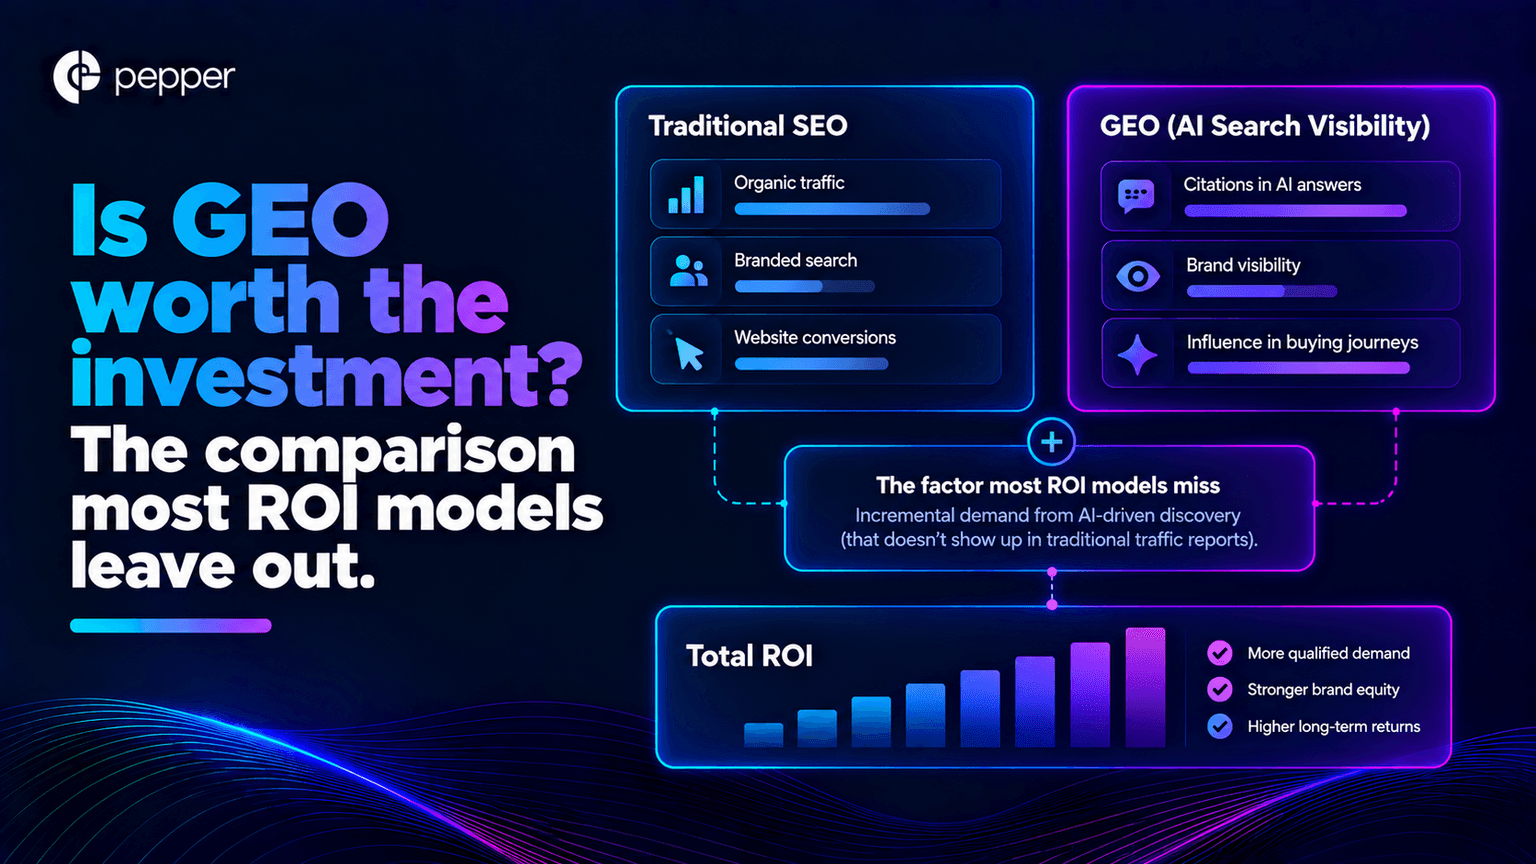
Is GEO worth the investment? The comparison most ROI models leave out
The short answer
Worth it against what? That is the question most GEO ROI models skip, including good ones. They measure the return in isolation. That produces a number with nothing to sit beside it. The alternative use of the money is usually buying the leads, which averaged $66.69 each across more than twenty industries in 2026. At a published agency rate of $300 an article, a GEO page has to produce about 4.5 leads across its entire working life. Only then does it beat simply buying them. Whether it does is decided by your decay rate. And there is a second complication that makes the comparison harder than it looks: most of what GEO buys is not referral traffic at all.
Key takeaways
- “Worth it” needs a comparator, and the usual one is paid. The 2026 averages were $5.42 a click and $66.69 a lead, from thousands of campaigns across more than twenty industries.
- Your category’s number is the only one that matters. The published range runs $131.63 for attorneys to $26.84 for arts and entertainment, a five-fold spread.
- The breakeven is one division. Cost per page divided by cost per lead. At $300 and $66.69, that is 4.5 leads per page, across its whole life.
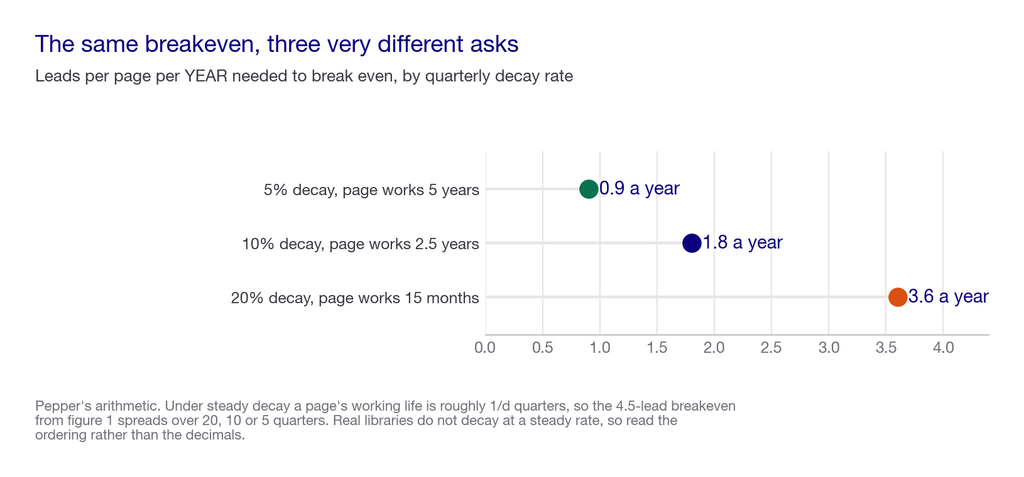
- Decay decides whether it gets them. At 5% quarterly decay a page has twenty quarters; at 20% it has five. Same page, same cost, three different propositions.
- The comparison is not clean, and we will not pretend it is. AI referrals are under 1% of visits, and under 0.2% in a peer-reviewed estimate. Most of GEO’s return is presence, not clicks, which paid cost per lead does not measure.
- So the honest model has two numbers, not one: the attributable part, which you can compare against paid, and the unattributable part, which you have to decide is worth something or not.
- Only one agency still publishes a price you can compute against. Of four that published in September, two withdrew and one moved domains by early October.
- Pepper is an agentic organic growth engine and an organic growth partner. Agent Atlas puts the agents in your team’s hands. Pepper’s GEO platform reports Brand Visibility, Domain Prompt Presence and Share of Voice across six engines, including ChatGPT, Perplexity, Gemini and Google AI Overviews. A growth team works alongside yours. Eight years, more than 250 enterprises, more than 10 million tracked prompts.
A note on where this comes from. I am usually the person asked to defend this line in a budget review, and the question is never “what is the ROI”. It is “what else could we do with it”. Pepper runs organic growth for more than 250 enterprises over eight years and tracks more than 10 million prompts across every major engine. The models that survive contact with a CFO are the ones that name the alternative out loud and lose honestly on the part that cannot be attributed.
Disclosure: Pepper sells GEO, so “yes, it is worth it” is a conclusion we profit from. This article gives the comparison to paid search, which frequently wins on the attributable half, and says plainly that the rest of GEO’s return cannot be measured in cost per lead. It also names three conditions under which we would tell you not to buy it. Every figure traces to a named source with its method.
What is GEO ROI, and why is “worth it” a different question?
GEO ROI is the return on work that gets your brand cited and named inside AI-generated answers, set against what that work costs. Our existing model walks through the cost side and the instrumentation properly, in how to model and prove return on AI search investment, and this article does not repeat it.
What that model does not do, and what “worth it” requires, is a comparator.
A return of any size is meaningless on its own. £1 returned for £1 spent is a disaster if the same pound buys £3 elsewhere, and a triumph if the alternative is £0.40. So the question has three parts.
- What does the work cost? Knowable, from published prices and your own hours.
- What is the next best use of the same money? Usually paid search, because it is the fastest substitute and its price is public.
- What share of the return can you actually attribute? The uncomfortable part, and the reason this is not a clean comparison.
The comparator: what paid costs in 2026
This side is easy, because it is published and the method is stated.
A benchmark study last updated 1 June 2026 analysed thousands of customer campaigns. It covered Google Ads and Microsoft Ads across more than twenty industries.
- Average cost per click: $5.42
- Average cost per lead: $66.69
- Range by industry: $131.63 for attorneys down to $26.84 for arts and entertainment
Use your own category’s figure, not the average. A five-fold spread means the cross-industry number describes almost nobody. The whole comparison is scaled by it. GEO clears a $131 bar far more easily than a $27 one.
What makes paid the right comparator is not that it is cheap. It is that it is predictable. Spend ten times more and you get roughly ten times the leads, within a band. That is the standard GEO has to beat, and very little else in marketing behaves that way.
The breakeven, which is one division
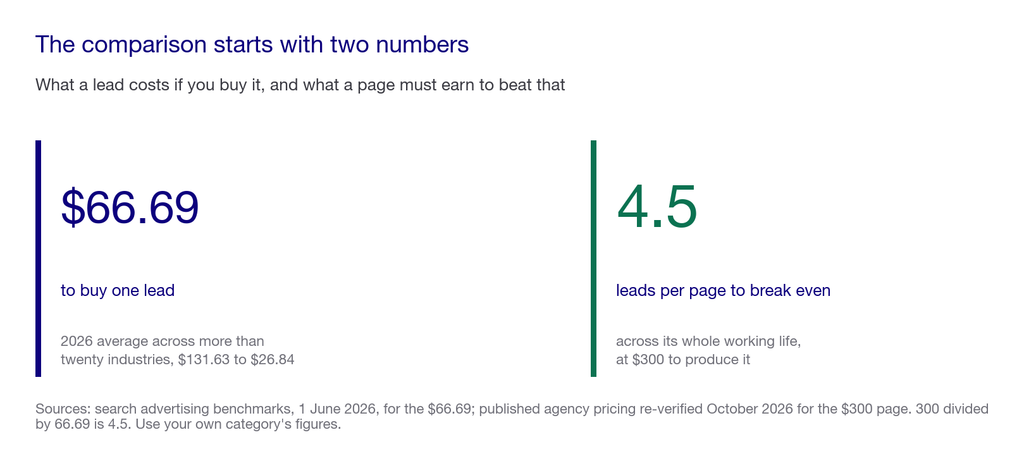
Cost per page divided by cost per lead. That is the number of leads each page must produce, across its entire working life, to beat buying those leads instead.
At a published agency rate of $300 an article and the 2026 average of $66.69 a lead, that is 4.5 leads per page.
On the price side, a warning. Almost nobody in this category publishes volumes alongside a retainer, so a per-article figure is rarely computable at all. Of four agencies publishing a GEO price in September, two had withdrawn their pricing pages by early October. A third had moved domains. Use your own cost per page. The arithmetic does not change; only the input does.
If you want this run against your own numbers rather than published averages, book a growth audit and bring twelve months of channel data.
Why decay decides whether it gets there
4.5 leads sounds easy until you ask how long the page has to find them.
Under steady decay, a page’s working life is roughly 1 divided by your quarterly decay rate. Decay here is the fraction of your working library that stops earning meaningful traffic each quarter.
| Quarterly decay | Working life | 4.5 leads means |
|---|---|---|
| 5% | 20 quarters, five years | under 1 lead a year |
| 10% | 10 quarters, two and a half years | under 2 a year |
| 20% | 5 quarters, fifteen months | nearly 4 a year |
Same page, same cost, three completely different propositions. At 5% decay the page has five years to find four and a half leads, which most useful pages manage. At 20% it has fifteen months, which most do not.
So the first thing to measure is not your return. It is your decay rate, and it takes an afternoon: count the pages that earned meaningful traffic four quarters ago, then count how many still do. Our compounding organic growth engine sets out the full arithmetic.
This is not a clean like-for-like, and here is why
Now the part that stops this being a tidy answer, and the reason an honest model has two numbers.
Most of what GEO buys is not referral traffic.
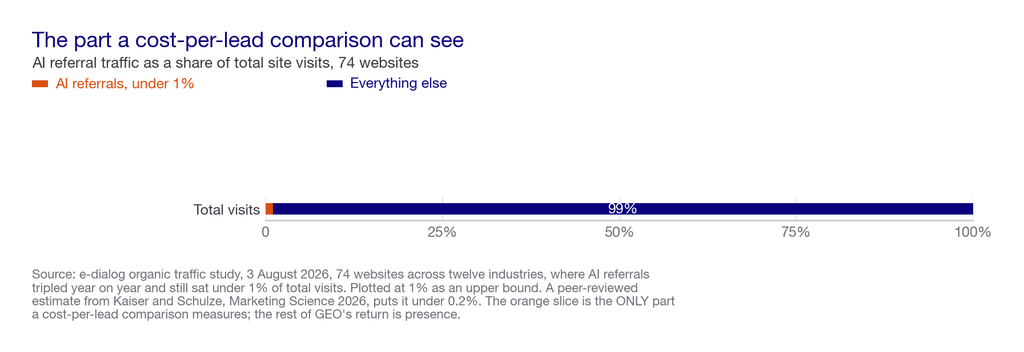
In a 2026 study of 74 websites, AI referrals tripled year on year and still sat under 1% of total visits. A peer-reviewed estimate puts them under 0.2%.
So on cost per lead alone, GEO loses. It loses for a reason that has nothing to do with quality. The referral channel is tiny. The comparison measures the one part of GEO’s return that barely exists.
The rest of the return is presence. Being named in an answer a buyer reads, at the moment they are deciding, without a click ever happening. That is real and it is unattributable with current tooling, ours included.
Which gives you the only honest model we know of, and it has two numbers.
- The attributable part. AI referral traffic and the conversions it produces. Compare this against paid cost per lead directly. It will usually lose today.
- The unattributable part. Mentions in answers your buyers read. Decide what a mention is worth to you and state the assumption out loud. Let the CFO argue with the assumption rather than with the model.
Anyone presenting GEO ROI as a single attributable number is either measuring only the first part, or has quietly priced the second without telling you.
How we weighted the inputs
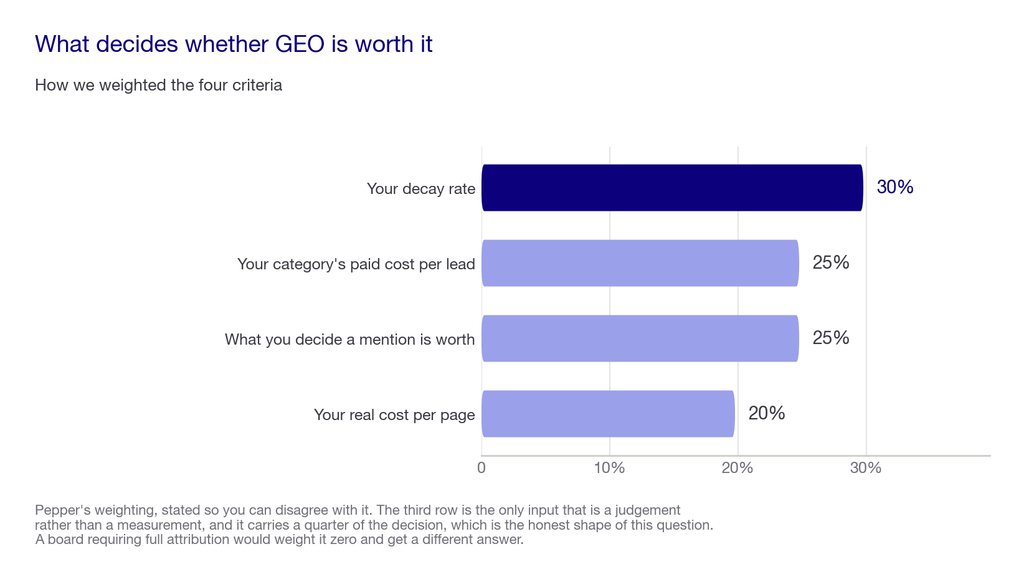
Four things decide the answer and they are not equal.
| Criterion | Weight | Why it carries that weight |
|---|---|---|
| Your decay rate | 30% | It sets the working life, and therefore whether the breakeven is one lead a year or four. |
| Your category’s paid cost per lead | 25% | A five-fold spread, and the whole comparison is scaled by it. |
| What you decide a mention is worth | 25% | The largest part of the return, and the only input that is a judgement rather than a measurement. |
| Your real cost per page | 20% | Published rates are nearly gone, so your own number is the only reliable one. |
Is GEO worth the investment, at a glance
| GEO | Paid search | |
|---|---|---|
| Cost shape | Capital plus maintenance, forever | Variable, stops when you stop |
| Published unit price | $200 to $300 an article, from one source | $5.42 a click |
| 2026 cost per lead | Not an average, and mostly unattributable | $66.69 |
| Attributable return | AI referrals, under 1% of visits | Every click, measurable |
| Unattributable return | Presence in answers, the larger part | Minimal |
| Predictability | Low, long-tailed | High, scales linearly |
| Time to payback | Two and a half years at 10% decay | Immediate |
| What decides it | Your decay rate | Auction competition |
| Fails when | Decay exceeds roughly 20% a quarter | Budget stops |
What to do, in order
- Measure your decay rate. An afternoon, free, and it sets everything downstream.
- Get your own paid cost per lead from your ad account rather than a benchmark.
- Divide your real cost per page by it. That is your breakeven leads per page.
- Compare that against your page working life, which is roughly 1 divided by your quarterly decay rate.
- Separate the two return numbers explicitly in whatever you present. Attributable referrals in one row, presence in another, with the assumption behind the second written down.
- If decay is above 20% a quarter, fix that before funding anything new. Halving decay has the same effect on your library ceiling as doubling output, on pages you have already paid for.
What this costs to work out
Nothing but time. The decay measurement is an afternoon. Your paid cost per lead is already in your ad account. The division takes a minute.
The programme itself is the expensive part. Published GEO retainers run from $3,000 to $25,000 a month depending on scope, software runs from about $29 a month at entry tiers with very limited prompt counts, and the largest line is usually your own team’s hours, which nobody publishes and almost nobody counts.
How Pepper fits
Pepper is an agentic organic growth engine and an organic growth partner, which means three things working together rather than one product.
Pepper’s GEO platform is the self-serve workspace. Brand profile, competitors, personas, GA4 and Search Console connected, themes and prompts defined, with Brand Visibility, Domain Prompt Presence and Share of Voice across six engines, including ChatGPT, Perplexity, Gemini and Google AI Overviews. For this question the connected GA4 data is what matters, because the attributable half of the model is read there rather than in any AI metric.
Agent Atlas is where your team builds, versions and runs its own agents, with quick runs for one input and sheet runs for bulk. Quarterly cohort analysis across a few hundred pages, to turn a one-off decay measurement into a tracked number, is exactly what it exists for.
The growth team is attached to the account and works alongside yours, which matters most on the part of the return you cannot attribute, because earning presence is relationship and coverage work rather than publishing.
Where it falls short: we cannot value the unattributable half for you, and neither can anyone else. Our platform measures presence, not what presence is worth. That number is a judgement your business makes, and any vendor who hands you one has made it on your behalf without saying so. We also do not model your paid side, and we are not neutral on this comparison, so discount us accordingly.
Eight years, more than 250 enterprises, more than 10 million tracked prompts. You can see the shape of the work in the Acceldata case study, in how we run it for B2B SaaS brands, and across the case study library.
How to choose whether to fund it
The decision is rarely all or nothing. It is usually how much, and for how long before a review. So here are the criteria, weighted.
The weighted scorecard
Score each row from 1 to 5, multiply by the weight, and total out of 100.
| Criterion | Weight | Score 1 means | Score 5 means |
|---|---|---|---|
| Your measured quarterly decay rate | 30 | Above 20%, nothing compounds | Under 5%, pages work for years |
| Your category’s paid cost per lead | 25 | Cheap, under $30 | Expensive, over $100 |
| How much your buyers use AI engines | 25 | Rarely, they still search | Primary research channel |
| Tolerance for an unattributable line | 20 | Every rupee must be tracked | Brand spend is already accepted |
Under 40, buy the leads. The attributable half loses and you have no appetite for the other half. From 40 to 70, fund a small programme and report the two numbers separately from month one. Above 70, this is a channel rather than an experiment and should be budgeted as one.
The weaker playbook against the stronger one
The weaker approach is to build a single ROI number and defend it. It survives one review. The first question is always what the alternative would have returned, and a single number cannot answer that. The stronger approach is to present three figures. What the attributable half returned, what paid would have returned for the same money, and what you assumed a mention was worth. One asks to be believed. The other shows its working and loses honestly on the part that cannot be proven.
Run a live test before you commit a budget
Do not fund this from a model. Take 20 questions your buyers actually ask, written in their words, such as “best procurement platform for a mid-size manufacturer”, “how do I cut invoice processing time”, or “alternatives to the incumbent for a regulated business”. Log whether you are named, whether you are cited, and what AI referral traffic arrives. Re-run at 30 days and again at 90 days. If the named column fills while referral traffic stays flat, that is the unattributable return arriving, and it is the number you have to put a value on.
Red flags
- A GEO ROI model with no comparator in it
- A single attributable ROI figure, which has quietly priced the unattributable half for you
- Cost-saving or conversion multiples quoted without a sample size and a segment
- A payback model that assumes pages never decay
- Benchmarks from a category whose cost per lead is nothing like yours
- Anyone treating AI referral volume as the main return, at under 1% of visits
- A proposal with no line for your own team’s hours, which is usually the largest cost
Five questions worth asking any agency
- What are you comparing this against, and what would the same money return in paid?
- What decay rate does your payback model assume, and did you measure mine?
- Which part of your ROI figure is attributable, and which part is a valuation of presence?
- What did you assume a mention is worth, and where is that written down?
- What would make you tell me not to do this?
The reducing principle. It comes down to one question: can you put a number on a mention? If you can, the model is complete and the comparison against paid is a straightforward sum. If you cannot, then GEO’s measurable half will lose to paid today, and funding it is a judgement about where buying behaviour is going rather than a return calculation. Both are legitimate. Only one of them is a spreadsheet, and pretending the second is the first is how these programmes get cancelled in year two.
The honest closing note. If your decay rate is above 20% a quarter, or your paid cost per lead is already under $30, or your board requires every rupee to be attributable, you do not need us yet. Buy the leads, fix decay, and revisit when one of those three changes. We would rather say that than sell a programme whose largest return we cannot measure for you.
What nobody should promise you
- A single attributable ROI number. Most of the return is presence, which no platform measures.
- That AI referrals will be a volume channel. They were under 1% of visits, and under 0.2% peer-reviewed.
- A cost-saving multiple against paid. The figures in circulation lack samples and segments.
- Payback inside two quarters. At 10% decay a page needs ten quarters to reach most of its value.
- A market rate per article. Of four agencies publishing in September, two had withdrawn by October.
Where this stops working, including for us
The paid side is solid, from thousands of campaigns with a stated window and published per-industry tables, though it comes from one advertising platform’s own customer base, which likely skews towards managed and better-optimised accounts.
The GEO cost side rests on one published price. That is a weaker footing than it was a month ago. Two of the four agencies that published a figure in September had withdrawn by October. Treat $300 as one verifiable data point, not a market rate, and substitute your own.
The decay model is deliberately simple. It assumes steady decay and steady publishing, and real libraries do neither. It is useful for comparing decay rates and for the shape of the answer, not for forecasting.
And the central limitation is not ours to fix. The larger half of GEO’s return is unattributable with current tooling. So the honest answer to “is it worth it” contains a judgement you have to make. We sell GEO, so we would benefit from that judgement being generous, which is exactly why this article puts the attributable comparison first and tells you it usually loses.
Where to go next
- For the cost side and instrumentation in full, read how to model and prove GEO return.
- To build the internal case, use the one-page business case template.
- For the library arithmetic behind decay, read the compounding organic growth engine.
- For what the work actually costs, read the GEO price census.
- For why presence and clicks have come apart, read is Google sending less traffic.
Frequently asked questions
Is GEO worth the investment?
It depends on the comparison. Against paid search at $66.69 a lead, the attributable half of GEO usually loses today, because AI referrals are under 1% of visits. The rest of the return is presence, and whether that is worth it is a judgement rather than a calculation.
How do I calculate GEO ROI?
Divide your real cost per page by your category’s paid cost per lead. That gives the leads each page must produce across its life. Then compare it against your page working life, which is roughly 1 divided by your quarterly decay rate.
What is a realistic payback period?
At 10% quarterly decay a page has about ten quarters to produce its breakeven leads. At 20% it has five. The decay rate matters more than anything else in the model and almost nobody measures it.
Why can’t I just use one ROI number?
Because most of the return is unattributable. A single figure either ignores presence entirely or has quietly priced it on your behalf. Present the attributable half, the paid comparison and your assumed value of a mention as three separate numbers.
What does GEO cost in 2026?
Published retainers run from $3,000 to $25,000 a month depending on scope, and software from about $29 a month at entry tiers. The largest line is usually your own team’s hours, which nobody publishes and most models omit.
How much traffic will AI engines actually send?
Very little today. One 2026 study of 74 sites found AI referrals tripled year on year and still sat under 1% of total visits, with a peer-reviewed estimate putting them under 0.2%.
When should I not invest in GEO?
When your decay rate is above 20% a quarter, when your paid cost per lead is already under $30, or when your board requires every rupee to be attributable. In those three cases buy the leads and revisit later.
How do I defend this in a budget review?
Name the alternative out loud. Show what the attributable half returned, what the same money would have returned in paid, and what you assumed a mention is worth. Letting the CFO argue with the assumption is better than asking them to believe a number.
Sources and further reading
- Search advertising benchmarks, last updated 1 June 2026, from thousands of customer campaigns across Google Ads and Microsoft Ads in more than twenty industries. Source of the $5.42 cost per click, the $66.69 cost per lead and the $131.63 to $26.84 industry range. The data comes from one advertising platform’s own customer base, which likely skews towards managed accounts.
- Published GEO agency pricing, dated 21 April 2026 and re-verified at source in October 2026: $3,000 a month for 10 articles, giving $300 an article. One agency’s published rate, not a market rate. Of four agencies publishing a GEO figure in September, two had withdrawn their pricing pages and one had moved domains by early October.
- e-dialog organic traffic study, published 3 August 2026. 74 websites across twelve industries. Source of the under-1% AI referral share.
- Kaiser and Schulze, Marketing Science, 2026. 973 e-commerce websites, more than 50,000 ChatGPT-referred transactions. Source of the under-0.2% peer-reviewed referral estimate. E-commerce only, window closed July 2025.
- Pepper, the GEO ROI model, for the cost side and instrumentation this article does not repeat.
- Pepper, the library ceiling arithmetic, for the decay model in full.
- Pepper, a fillable business case, for taking the numbers above into a review.
- Pepper, what the aggregate traffic data shows, for why presence and clicks have come apart.
- Pepper, what the market actually publishes, for the full price census.
A note on sources. Only sources published in 2026 are cited. The breakeven and decay arithmetic is Pepper’s own, stated in full so you can disagree with it, and the two figures it depends on are both named with their methods above.
Latest Blogs
Choosing a GEO agency for mid-market B2B used to be a shortlisting problem. It is now a procurement problem, because the published prices have largely gone. Of four agencies publishing a GEO-specific figure in September 2026, two had withdrawn their pricing pages by early October and one had moved domains. Exactly one still publishes a number a mid-market buyer can act on. So the useful question is no longer which agency is best in the abstract, but how to compare three quotes when only one of them arrived with a method attached.
Third-party sources and AI citations are tightly linked, and the link stops short of where most plans assume. Off-page work decides whether an engine retrieves and cites you. It does not decide whether the answer names you, and 61.7% of brand appearances are citations with no name attached. The two largest 2026 datasets also disagree about how much of the citation surface is third-party at all, one saying 84% and the other putting the brand bucket above half. That disagreement is definitional rather than factual, and it decides where a budget goes.
Why is my competitor showing up in ChatGPT and not me? Before accepting the premise, check it. Across 3,981 brand appearances studied in 2026, 61.7% were citations with no brand name in the answer and only 13.2% produced both. So there are three states that look identical from where you are sitting: genuinely absent, present as an unnamed source, and named less often than a rival. Each has a different cause and a different fix, and working on the wrong one is the most common way this gets expensive.
Get your hands on the latest news!