From SEO to GEO: how search optimisation actually evolved

The short answer
The generative engine optimization vs traditional SEO debate is usually framed as a rupture. One discipline ending, another beginning. That framing has been wrong every previous time it was used, and it is mostly wrong now.
What actually changed is the interface. What stayed the same is the mechanism. Google confirmed as much in May 2026. Its guidance states that AEO and GEO are part of SEO, that AI Overviews and AI Mode run on the core Search ranking and quality systems, and that there is no separate AI index.
But “mostly wrong” is not “wrong”, and the honest version has a number in it.
Key takeaways
- SEO is still worth it, and how much depends on one measurable thing. What share of your queries return an AI Overview? That number is category-specific, and you can check it this afternoon.
- Where no Overview appears, click-through actually improved. Across 53 brands and 2.43 billion impressions, it rose from 2.93 to 3.82 percent between January 2025 and February 2026.
- Where one appears, it fell hard. On the same dataset, click-through fell from 3.19 to 1.31 percent before recovering to 2.36. A separate analysis of 300,000 keywords found an Overview correlates with a 58 percent lower rate for the top-ranking page.
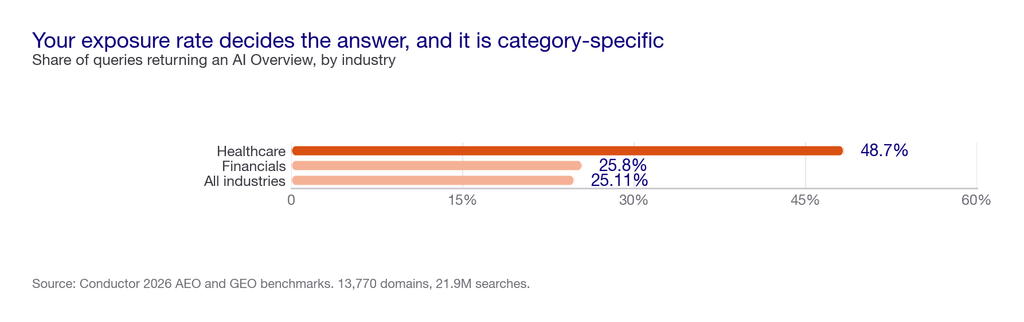
- Exposure varies by category. AI Overviews appear on 25.11 percent of queries across all industries and 48.7 percent in healthcare.
- The work that survived every previous era survived this one too. Being findable, being clear, and being trusted by other people. That has been the answer for over a decade.
Where this comes from. We run organic for more than 250 enterprises at Pepper and track over 10 million prompts across every major engine. The view below is shaped by that, by the client reviews we sit in every week, and by conversations with operators at the events we run. We sell organic, so weigh the conclusion accordingly. Every figure comes from a source you can open.
What is generative engine optimization, and how does it differ from traditional SEO?
Traditional SEO is the practice of making a site findable, understandable and preferable to a search engine, so it appears in a ranked list.
Generative engine optimization is the practice of making your material the thing an engine quotes when it composes an answer, rather than a link offered alongside one.
Three differences are real, and one commonly claimed difference is not.
- The unit of success changed. Traditional SEO wins a position. GEO wins a citation inside an answer, which may produce no visit at all.
- The venue multiplied. One results page became several assistants, each with different citation habits. ChatGPT cites in 96 percent of responses, Gemini 82 percent, Claude 55 percent.
- The centre of gravity moved off your domain. 84 percent of AI citations come from earned media, and just 0.3 percent from paid or advertorial content. You can no longer do all the work on pages you control, which is the argument we set out in organic growth vs paid.
- What did not change is the machinery. This is the commonly claimed difference that is false. There is no separate AI index, and no parallel ranking system to optimise for.
For the definitional argument in full, we wrote AEO vs SEO and what GEO is.
See where you show up. Pepper’s GEO platform tracks Brand Visibility, Domain Prompt Presence and Share of Voice across ChatGPT, Perplexity, Gemini, Claude and Google AI Overviews. Your team can log in, connect Search Console and GA4, manage the prompt set and run your own agents in the Agent Atlas. A growth team works the same account alongside you. Book a growth audit or see where you show up.
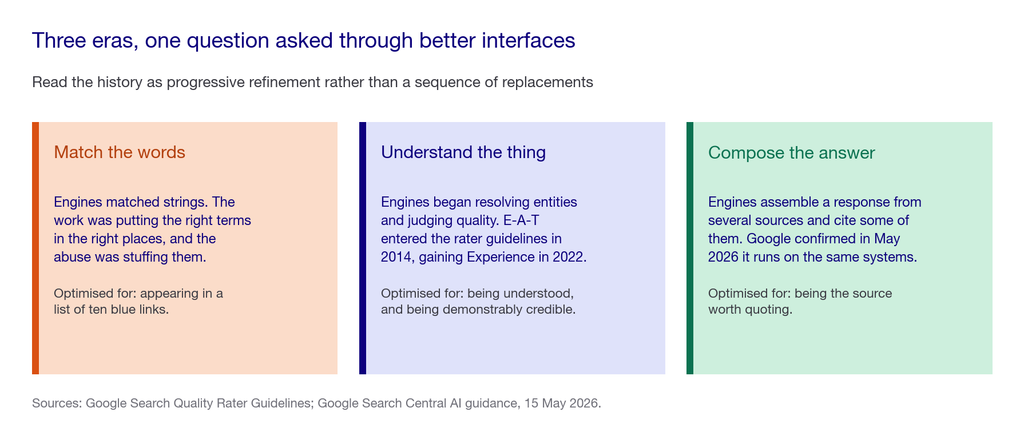
Three eras, and what each one actually optimised for
The useful way to read the history is not as a sequence of replacements. It is as the same question being asked through progressively better interfaces.
What never changed
Every era added a requirement. None of them removed one, which is why the list below has only grown.
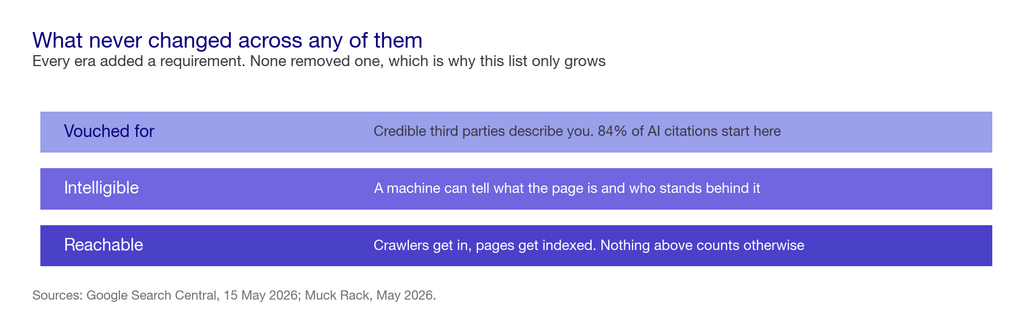
The constants are unglamorous, and they are why SEO keeps surviving its own obituaries. If a page cannot be reached, nothing else matters. If a machine cannot tell what it is about, nothing else matters. And if nobody credible vouches for it, it loses to something that has both.
Google’s May 2026 guidance is the clearest statement of this continuity from the source itself. It was filed under SEO fundamentals rather than published as a new discipline. It also names several fashionable tactics as unnecessary: llms.txt files, content chunking, AI-specific rewrites, inauthentic mentions and structured-data over-optimisation. We covered the technical detail in schema, llms.txt and what actually matters.
What genuinely changed, and what it cost
This is where the honest version diverges from the reassuring one.
Seer Interactive tracked 53 brands, 5.47 million queries and 2.43 billion organic impressions from January 2025 to February 2026. They split the results by whether an AI Overview appeared.
- No AI Overview present: click-through rose from 2.93 percent in January 2025 to 3.97 percent in December. It settled at 3.82 percent in February 2026.
- AI Overview present: click-through fell from 3.19 percent to 1.31 percent, recovering to 2.36 percent.
Ahrefs reached the same conclusion by a different method. It compared 150,000 keywords with AI Overviews against 150,000 informational keywords without them, measuring average desktop click-through in December 2023 against December 2025. An Overview now correlates with a 58 percent lower rate for the top-ranking page, against 34.5 percent in its April 2025 analysis. Ahrefs says correlates rather than causes, and so do we.
Two independent datasets, two methods, one direction. The decline is real, and it is confined to a specific and measurable slice of your queries.
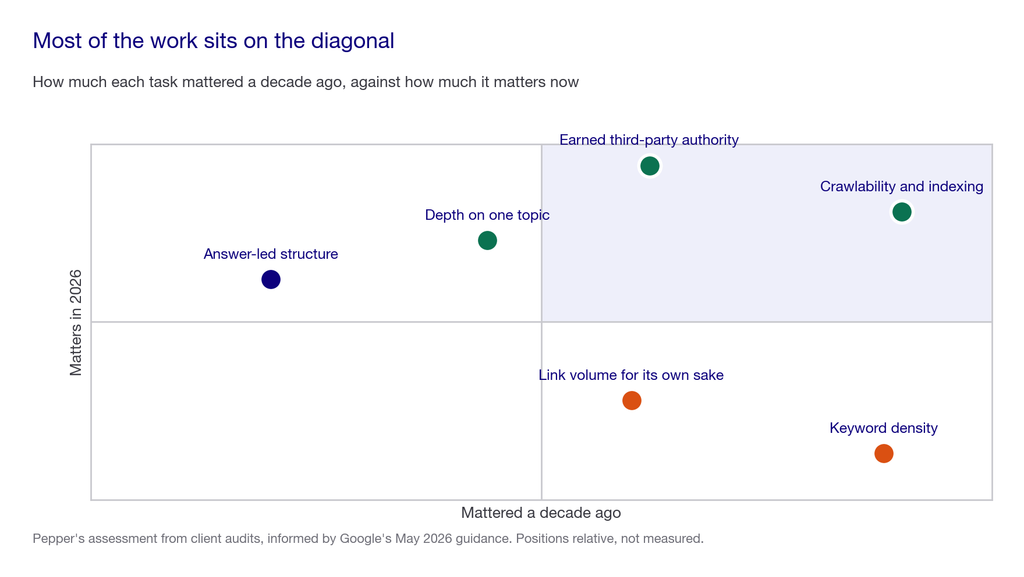
So is SEO still worth it in 2026?
Yes, and the useful version of the question is different.
Stop asking whether SEO is worth it in general. Ask what share of your queries return an AI Overview. That single number decides the answer for your business.
- Low exposure. If few of your queries carry an Overview, your click economics have barely moved. The Seer data suggests they may even have improved. Keep doing what you were doing.
- High exposure. If most do, position alone no longer earns the click. The work shifts toward being cited inside the answer rather than ranked beneath it.
- Either way the underlying work is the same. Depth, clarity, technical health and third-party corroboration serve both outcomes. That is why there is no second budget to raise.
Conductor’s 2026 benchmarks, across 13,770 domains and 21.9 million searches, put AI Overview penetration at 25.11 percent across all industries, 48.7 percent in healthcare and 25.8 percent in financials. So the answer genuinely differs by category, and a blanket verdict on SEO is not available to anyone.
What this looked like on real accounts
Two programmes, both in the period when the category-level numbers were falling.
On SalesHood, a content engine of 20 new pieces and 8 refreshed ran alongside technical fixes and tracking. Clicks rose 20 percent against an industry-wide decline, AI Overview visibility went from 14 keywords to 97, and rich results grew 291 percent in five months.
On Acceldata, organic traffic grew 6X, top-three rankings went from 85 to more than 300, and a single hero guide produced more than 260,000 impressions on its own.
Where this evidence is limited. Two accounts, published on our own case study pages, and selected because they worked. Not a controlled study. They show the decline is not inevitable, and they do not prove your account behaves the same way.
Our methodology: how we weighted the evidence
| Criterion | Weight | What that means here |
|---|---|---|
| Independent datasets agreeing | 35% | Two studies, two methods, same direction carries more than either alone |
| Stated sample and method | 30% | Every figure has a published sample size and a described approach |
| Splits the effect rather than averaging it | 25% | A blended decline number hides that one cohort improved |
| Published in 2026 | 10% | Engine behaviour moved enough that older figures describe a different system |
Generative engine optimization vs traditional SEO at a glance
| Traditional SEO | Generative engine optimization | |
|---|---|---|
| Unit of success | A ranked position | A citation inside an answer |
| Venue | One results page | Several assistants, each citing at different rates |
| Where the work sits | Mostly your own domain | 84% of citations come from sources you do not own |
| What it costs | Already in your budget | No second budget. Roughly $99 to $400 a month if you want per-engine tracking |
| How you measure it | Rankings, impressions, clicks | Whether you are named, and whether you are cited, per engine |
| Where it falls short | Ranking no longer guarantees the click where an Overview appears | A citation does not guarantee a visit either, so it needs pairing with demand capture |
—
How to choose what to fund
The exposure number decides this. Measure it before you move any budget.
The scorecard
Score your situation out of 100.
| Area | Weight | How to score it honestly |
|---|---|---|
| AI Overview exposure, measured | 30% | You know what share of your top queries return an Overview, because someone checked rather than assumed |
| Citation presence on exposed queries | 25% | On the queries that do carry an Overview, you appear in the source list |
| Technical floor | 20% | Pages indexed, crawlers unblocked, answers present in the raw HTML |
| Third-party corroboration | 15% | Credible independent sources describe you accurately, since that is where most citations originate |
| Measurement that splits the cohorts | 10% | Your reporting separates queries with an Overview from those without, rather than averaging them |
The live test, over 90 days
Fix 30 prompts covering your commercially important questions, phrased the way buyers type them. Real questions, such as “is SEO still worth it in 2026”, “what is the best data observability platform”, “how do I measure AI search visibility” and “which sales enablement tool suits mid-market teams”.
Run them across Google, ChatGPT and Perplexity. For each, record three things: whether an AI Overview appeared, whether you were named, and whether a page on your domain was cited.
Rerun the identical set monthly for 90 days. Three readings is the shortest honest window: one is a snapshot, two could be noise, three shows direction. Keep the set fixed, because changing it resets the comparison.
The first column is the one that answers this article’s question. Count the Overviews, and you have your exposure rate. If the clicks have already gone, the full diagnostic is here.
Weak approach versus strong approach
The weaker approach: read that SEO is dead, cut the organic budget and move it to paid. Then discover that paid and advertorial content accounts for 0.3 percent of AI citations, with no route into the answer at all.
The stronger approach: measure your exposure rate first. Keep funding the fundamentals that serve both outcomes, then add citation tracking so you can tell the two cohorts apart in your own reporting.
The weak version acts on a category-level headline. The strong version acts on your own number, which is the only one that determines your outcome.
Red flags
- “SEO is dead.” Google filed its AI guidance under SEO fundamentals, and said AEO and GEO are part of SEO. Anyone leading with the obituary is selling the replacement.
- A separate GEO budget line. There is no separate index, so a parallel programme usually means two teams optimising the same pages.
- Category-level decline numbers applied to you. Exposure ranges from a quarter of queries to nearly half depending on industry.
- A blended click-through figure. It averages together one cohort that fell and one that rose, which destroys the only actionable split in the data.
- llms.txt or AI-specific rewrites in the plan. Both named as unnecessary in Google’s May 2026 guidance.
- Guaranteed rankings or citations. Nobody controls generated output, and Google warns against providers guaranteeing rankings.
Five questions worth asking
- “What is our AI Overview exposure rate?” If nobody knows, that is the first thing to measure, and it is free.
- “Does our reporting split queries with an Overview from those without?” If not, your dashboard is averaging away the finding.
- “How much of the proposed work is off our domain?” If none, it addresses the minority of the citation signal.
- “What in Google’s May 2026 guidance changes your recommendations?” Anyone unfamiliar with it is working from last year’s playbook.
- “What would you stop doing?” A good partner cuts something rather than adding a discipline.
Reduced to one principle: measure your exposure before you change your budget.
One closing note that costs us something. We sell organic, so a conclusion of “keep funding organic” is exactly what you would expect from us. Every agency’s verdict matches what it sells, ours included. The only defence is that all four figures above come from parties with no stake in our answer, and you can open every one.
What does this cost?
| What you are buying | Typical 2026 cost | What it covers |
|---|---|---|
| Measuring your exposure rate | Free, an afternoon | Running your top 30 queries and counting the Overviews |
| Search Console and Bing Webmaster Tools | Free | First-party reporting, including generative AI performance data |
| Manual citation tracking | Free, about two hours a month | 30 prompts across three engines, named and cited logged separately |
| The fundamentals | Already in your budget | Technical health, depth, clarity. They serve both outcomes |
| Third-party corroboration | The largest line item, and the slowest | Where 84 percent of citations originate |
| Multi-engine tracking platform | Roughly $99 to $400 a month | Automated per-engine visibility and competitor share of voice |
| Platform plus a growth team | Custom | Pepper: tracking, plus the people and agents doing the work it points at |
The first three rows are free, and the first one answers this article’s question for your business in about an afternoon.
What nobody should promise you
That SEO is dead, or that GEO replaces it. Google’s own position is that one contains the other.
That your pre-Overview traffic can be restored. On exposed queries the decline is real, and even cited brands did not escape it.
A guaranteed citation, ranking or position. Nobody controls generated output.
A single blended visibility score. It averages a cohort that improved together with one that fell, which is the opposite of useful.
When to spend the money elsewhere
The answer that costs us the sale. If your exposure rate is low, your rankings are healthy and your clicks are steady, you do not need a GEO programme yet and we would tell you not to buy one.
Keep doing the fundamentals and recheck your exposure in six months. Spend the difference on something with a nearer-term return. The trigger to revisit is your exposure rate climbing, not a headline about the death of search.
Frequently asked questions
What is the difference between generative engine optimization and traditional SEO?
Traditional SEO wins a ranked position in a list of links. Generative engine optimization wins a citation inside a composed answer. The machinery underneath is shared. Google confirmed in May 2026 that AI Overviews run on core Search ranking systems with no separate AI index.
Is SEO still worth it in 2026?
Yes, and how much depends on what share of your queries return an AI Overview. Where none appears, click-through actually rose from 2.93 to 3.82 percent across one large dataset. Where one appears, it fell sharply.
Has GEO replaced SEO?
No. Google’s May 2026 guidance states that AEO and GEO are part of SEO, and it was filed under SEO fundamentals. The practical consequence is that there is no second budget to raise, and no parallel programme to run.
How much did AI Overviews reduce clicks?
Two independent analyses agree on direction. One found click-through on AI Overview queries fell from 3.19 to 1.31 percent before partially recovering. Another found an Overview correlates with a 58 percent lower click-through rate for the top-ranking page.
How do I know how exposed my site is?
Take your top thirty queries by impressions, run each one, and count how many return an AI Overview. That percentage is your exposure rate. It costs an afternoon, and it determines how much of this applies to you.
Do I need a separate budget for GEO?
Almost never. The fundamentals that serve rankings also serve citations. The only additional cost is measurement, at roughly $99 to $400 a month if you want it automated rather than run by hand.
What has actually stayed the same across every era of SEO?
Being reachable, being intelligible to a machine, and being vouched for by credible third parties. Every era added requirements on top of those three and none removed them.
Is paid advertising a safer bet now?
Not for this particular job. Paid and advertorial content accounts for 0.3 percent of AI citations against 84 percent for earned media. Paid captures existing demand well, and it cannot buy its way into an answer.
Where to go next
Take your top thirty queries, run them, and count the Overviews. That percentage is your exposure rate. It converts a category-level argument into a decision about your own business.
Everything else on this page is context for that one number.
Learn AI Search · Book a growth audit · Read the case studies
Sources and further reading
- Seer Interactive. “AIO Impact on Google CTR: 2026 Update.” 53 brands, 5.47 million queries, 2.43 billion organic impressions, January 2025 to February 2026. No AI Overview present: 2.93 percent rising to 3.97 and settling at 3.82. AI Overview present: 3.19 percent falling to 1.31 and recovering to 2.36. The authors state they cannot claim causation. Link
- Ahrefs. AI Overviews and clicks, updated analysis. 150,000 keywords with AI Overviews against 150,000 informational keywords without, comparing average desktop click-through in December 2023 with December 2025, using Keywords Explorer and aggregated Search Console data. Finds an Overview correlates with a 58 percent lower average click-through rate for the top-ranking page, against 34.5 percent in the April 2025 analysis. States correlation rather than causation. Link
- Google Search Central. AI search optimisation guidance, 15 May 2026, filed under SEO fundamentals. Confirms AEO and GEO are part of SEO, that AI Overviews and AI Mode run on core Search ranking and quality systems with no separate AI index, and names llms.txt, content chunking, AI-specific rewrites, inauthentic mentions and structured-data over-optimisation as unnecessary.
- Conductor. 2026 AEO and GEO benchmarks. 13,770 domains and 21.9 million searches. Source of the 25.11 percent all-industry, 48.7 percent healthcare and 25.8 percent financials figures.
- Muck Rack. “What Is AI Reading?” May 2026. More than 25 million cited links across ChatGPT, Claude and Gemini. Source of the 84 percent earned media, 0.3 percent paid, and the 96, 82 and 55 percent citation rates. Link
- Pepper. SalesHood case study and Acceldata case study. Figures as published on those pages.
- Deliberately excluded: the “61 percent click-through decline” figure, untraceable to a stated sample and method. Also a 2025 academic benchmark on source influence in generative engines, which predates 2026 and tests a constructed environment rather than live engines.
Latest Blogs
Most advice on this is inference dressed as fact. OpenAI documents exactly one thing clearly, which is access. Here is what is documented, what is inferred, and how to verify the rest for yourself.
Being named in an AI answer and having your page used as its source are different outcomes with different causes and different fixes. The gap between them is the most useful diagnostic in AI search, and most reporting collapses it into one number.
Every platform reports share of voice and almost none of them define it the same way. Here is the definition worth using, the three choices that change the number, and how to measure it yourself without buying anything.
Get your hands on the latest news!