Organic growth vs paid: the rent-versus-own argument

The short answer
The old version of this argument was about compounding. Paid stops the day you stop paying, and organic keeps working. True, and both sides have heard it often enough that nobody’s budget moves.
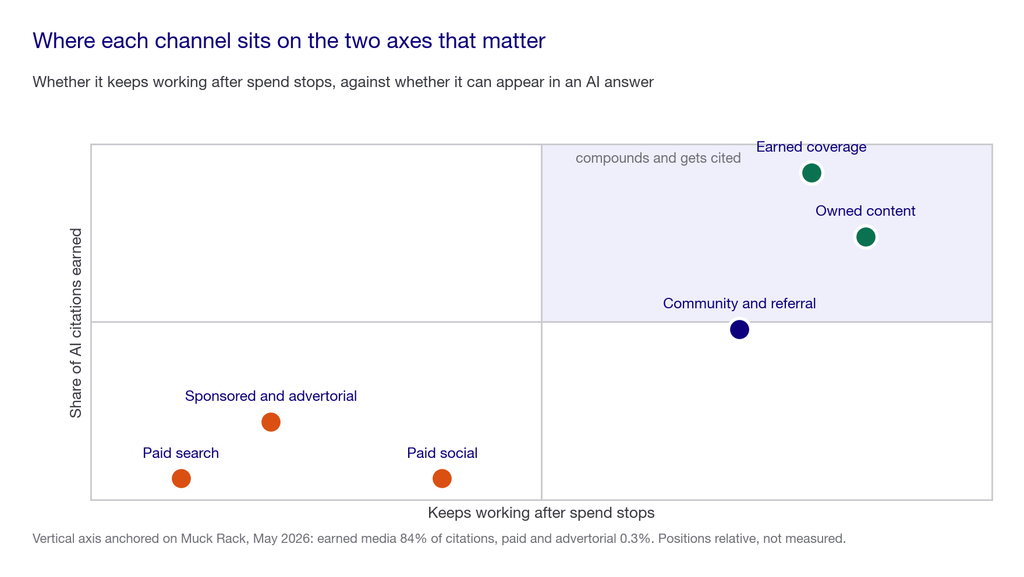
There is a harder version now. Paid and advertorial content accounts for 0.3 percent of AI citations. Earned media accounts for 84 percent. So on the surface where buyers increasingly assemble their shortlist, the paid channel is not expensive. It is largely absent.
Key takeaways
- Organic growth is the demand you earn through content, search, reputation and referral. Advertising is the attention you rent.
- 94 percent of B2B buyers used AI somewhere in a recent purchase, and 55 percent compared vendors inside AI tools directly. Forrester surveyed nearly 18,000 buyers.
- You cannot buy a citation. Paid and advertorial content is 0.3 percent of AI citations against 84 percent for earned media, across 25 million-plus cited links.
- This is not an argument to stop paid. Ads still capture demand that already exists. They just cannot manufacture the trust that decides an AI answer.
- The compounding is real and measurable. On one Pepper account, organic traffic grew 700 percent over two years and revenue attributed to organic search rose 177 percent.
Where this comes from. We run organic for more than 250 enterprises at Pepper and track over 10 million prompts across every major engine. We sell organic, so read the argument below with that in mind, and note that every number is from a primary source you can check rather than from us.
What is organic growth?
Organic growth is customer acquisition that does not require paying a platform per impression or click. It comes from assets you own, or reputation you have earned:
- Search visibility, both classic organic rankings and citations inside AI answers. These increasingly run on the same underlying systems, as we set out in AEO vs SEO.
- Content that answers real buyer questions, published on domains you control. It keeps working long after the brief that produced it is forgotten.
- Earned coverage and third-party reputation, meaning the credible sources that describe you without being paid to. Working them is its own discipline, covered in LLM seeding.
- Referral, community and word of mouth, which is the oldest form of the same mechanic: someone else vouching for you.
The defining property is that the asset persists. A paid campaign delivers results proportional to spend, for as long as spend continues. An organic asset delivers for as long as it stays accurate and retrievable. That is why the cost curve bends the other way.
See where you show up. Pepper’s GEO platform tracks Brand Visibility, Domain Prompt Presence and Share of Voice across ChatGPT, Perplexity, Gemini, Claude and Google AI Overviews. Your team can log in, connect Search Console and GA4, manage the prompt set and run your own agents in the Agent Atlas. A growth team works the same account alongside you. Book a growth audit or see where you show up.
Rent versus own, stated properly
The framing is old and it is still the clearest way to think about a channel mix.
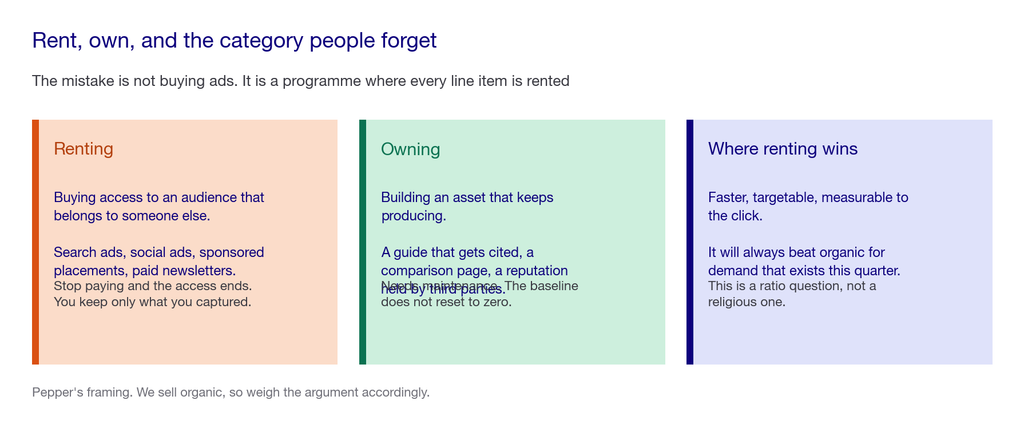
- Renting is buying access to an audience that belongs to someone else. Search ads, social ads, sponsored placements, paid newsletters. Stop paying and the access ends, leaving only what you captured while the meter ran.
- Owning is building an asset that continues to produce. A guide that ranks and gets cited, a comparison page answering what your sales team fields weekly, a reputation held by third parties. Maintenance is required. The baseline does not reset to zero.
- The honest third category is that renting is genuinely better at some jobs. It is faster, targetable and measurable to the click. It will always beat organic at capturing demand that already exists this quarter.
The mistake is not buying ads. The mistake is running a growth programme where the only line items are rented, so that year three costs more than year one for the same result.
What changed: the surface where decisions form
Two verified numbers, and the argument between them.
First, where buyers now go. Forrester’s 2026 Buyers’ Journey Survey was published on 21 January 2026 and covered nearly 18,000 global business buyers. It found 94 percent used AI somewhere in a recent purchase process. 55 percent compared vendors inside AI tools directly, 54 percent researched products there, and 47 percent built the internal business case with them. Self-reported, so read the ordering as firmer than the exact levels.
Second, what those tools cite. Muck Rack analysed more than 25 million cited links across ChatGPT, Claude and Gemini in May 2026. Earned media accounted for 84 percent of citations. Journalism alone was 27 percent. Paid and advertorial content accounted for 0.3 percent.
Put those together and the argument stops being about compounding economics. It becomes about access. The shortlist is increasingly assembled inside a surface that almost never cites the channel you can buy.
This is not a claim that ads stopped working. It is a claim about a specific and growing stage of the buying process, where a model decides which three vendors to name, and does so overwhelmingly on evidence nobody paid it to consider.
Google’s May 2026 guidance reinforces the mechanism from the other direction. AI Overviews and AI Mode run on core Search ranking and quality systems, with no separate AI index. So the organic work you already do compounds into AI answers rather than needing a parallel budget.
What compounding actually looked like
Apollo 24/7 is an enterprise healthcare organisation in India running a digital ecosystem from patient discovery through to post-care. It is the clearest compounding example we can point to, because the programme ran long enough to show the curve.
The published results:
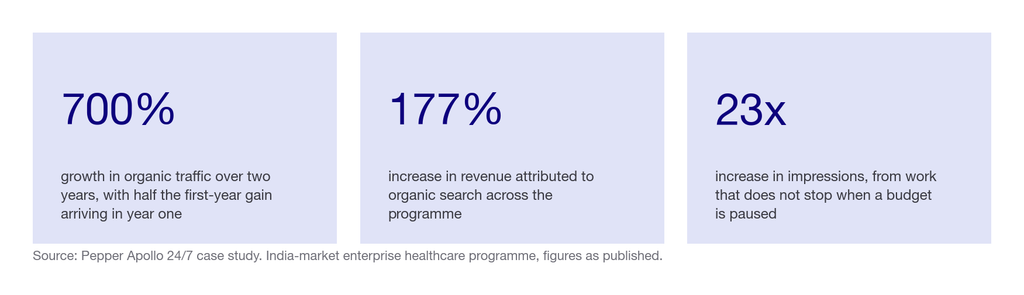
- 700 percent growth in organic traffic over two years, with 50 percent of that arriving in the first year alone.
- 177 percent increase in revenue attributed to organic search, and 77 percent organic revenue growth within a single year.
- 23x increase in impressions across the programme.
- 2.5x more new users acquired, and a 16x increase in video reach.
- 15 percent average month-on-month revenue growth.
The work behind it was ownable rather than rentable. 400 thought-leadership blogs authored by doctors, 200 expert-authored articles, an analysis of more than 50,000 pages, and 4,000 local posts. None of that stops producing when a campaign budget is paused.
Two shorter examples make the same point in different categories. On Acceldata, organic traffic grew 6X and a single hero guide produced more than 260,000 impressions on its own. On SalesHood, clicks rose 20 percent against an industry-wide decline, and AI Overview visibility went from 14 keywords to 97.
Where this evidence is limited, and you should know it. These are our own client results, published on our own case study pages, in three different markets and industries. They demonstrate that the compounding is real on real accounts. They are not a controlled study, and we would not present them as one.
Our methodology: how we weighted the comparison
| Criterion | Weight | What that means here |
|---|---|---|
| Eligibility on the deciding surface | 35% | Whether the channel can appear where the shortlist forms. Paid content is 0.3% of AI citations |
| Persistence after spend stops | 30% | Whether the asset keeps producing, which is the original rent-versus-own point |
| Speed to first result | 20% | Where paid genuinely wins, and we say so rather than pretending otherwise |
| Measurability | 15% | Paid attributes to the click. Organic requires named-versus-cited tracking per engine |
**What we could not verify and left out.** Every specific CAC comparison circulating on this topic, including the widely repeated organic-versus-paid CAC figures and the claim that acquisition costs rose 40 to 60 percent in two years. Each traces to a marketing blog citing another marketing blog rather than to a study with a stated sample and method. We would rather make the argument on four verified numbers than on twelve unverifiable ones.
Organic and paid at a glance
| Channel | What it is best at | Typical cost shape | Eligible for AI citation | Where it falls short |
|---|---|---|---|---|
| Paid search | Capturing demand that exists now | Per click, forever | Effectively no. Paid content is 0.3% of citations | Stops the day you stop. Costs rise as competitors bid |
| Paid social | Reaching people before they search | Per impression, forever | Effectively no | Weakest intent, and the audience belongs to the platform |
| Sponsored and advertorial | Borrowed credibility, fast | Per placement | Barely. It sits inside the 0.3% | Reads as paid to both humans and models |
| Owned content | Answering the questions that decide a deal | Front-loaded, then maintenance | Yes, and it is what your domain gets cited for | Slow to start, and it fails if the depth is not real |
| Earned coverage | Third-party corroboration | Effort rather than media spend | Yes. This is the 84% | Least controllable, and it cannot be bought outright |
| Community and referral | Trust at the closing stage | Time and programme cost | Indirectly, via what participants publish | Hard to scale and harder to attribute |
—
How to choose your mix
The answer is almost never all of one. It is a ratio, and the ratio should shift with what you are trying to buy.
The scorecard
Score your current programme out of 100.
| Area | Weight | How to score it honestly |
|---|---|---|
| Presence where shortlists form | 30% | You appear when buyers ask AI engines for options in your category, and you have checked rather than assumed |
| Owned asset base | 25% | You have pages that produce results today which were commissioned more than a year ago |
| Earned corroboration | 20% | Credible third parties describe you accurately without being paid, and you can name three |
| Paid efficiency | 15% | Your paid spend captures existing demand rather than trying to create awareness it cannot sustain |
| Measurement across both | 10% | You track named and cited per engine alongside your paid attribution, not one or the other |
The live test, over 90 days
Fix 30 prompts that describe the decisions your buyers actually make. Real questions, such as “what is the best data observability platform”, “who are the top sales enablement vendors for mid-market”, “what does Apollo 24/7 offer” and “what is organic growth”.
Run them across Google, ChatGPT and Perplexity and record, for each:
- Whether you appear at all, which tells you if the owned and earned work has reached this surface.
- Whether a page you own is cited, which separates being known from being quotable.
- Which sources appeared instead, which becomes the target list for earned work.
Rerun the identical set monthly for 90 days. Three readings is the shortest honest window: one is a snapshot, two could be noise, three shows direction. Keep the set fixed, because changing it resets the comparison.
Run it alongside your paid dashboard rather than instead of it. The interesting number is how much of your pipeline touched a surface your paid spend cannot reach. If you want the free version of the method, it is in how to measure AI search visibility without expensive tools.
Weak approach versus strong approach
The weaker approach: set the split by last year’s split, judge organic on the same monthly attribution window as paid, conclude after one quarter that organic is not working, and move the budget back.
The stronger approach: fund organic as an asset with a build period, judge it on a fixed prompt set over three readings, and keep paid pointed at demand capture where it genuinely outperforms.
The difference is the measurement window. Organic judged on a paid timescale always loses, which is how the decision gets made wrongly in most companies.
Red flags
- Anyone who tells you to stop paid entirely. Paid captures existing demand better than organic does, and a company that needs pipeline this quarter needs both.
- Organic proposals with no earned component. On-domain publishing addresses the minority of the citation signal.
- CAC comparisons with no cited study. The figures circulating on this topic overwhelmingly trace to blogs citing blogs.
- Sponsored placement sold as authority. Paid and advertorial content is 0.3 percent of AI citations.
- Guaranteed rankings or citations. Nobody controls generated output, and Google warns against providers guaranteeing rankings.
- Attribution that only counts last click. It will systematically undervalue the surface where the shortlist actually formed.
Five questions worth asking
- “What would we still have in twelve months if we paused spend?” The clearest way to separate what you own from what you rent.
- “Do we appear when buyers ask an AI engine for options in our category?” If nobody has checked, that is the first thing to fix.
- “How much of the organic proposal is off our domain?” If none, it addresses the minority of the signal.
- “What timescale are we judging this on?” Organic on a paid measurement window is a decision already made.
- “What would you tell us to cut?” A good partner cuts something. A weak one only adds a channel.
Reduced to one principle: rent to capture demand that exists, own to become the answer when it forms.
One closing note that costs us something. We sell organic, so we are the least neutral party you will read on this, ours included in the general point that every agency’s channel recommendation matches what it sells. Ask us, and anyone else, which channel we would tell you to spend less on.
What does organic growth cost?
| What you are buying | Typical cost shape | What it covers |
|---|---|---|
| Search Console and Bing Webmaster Tools | Free | First-party reporting, including Google’s generative AI performance reports |
| Manual AI visibility tracking | Free, about two hours a month | 30 prompts across three engines, named and cited logged separately |
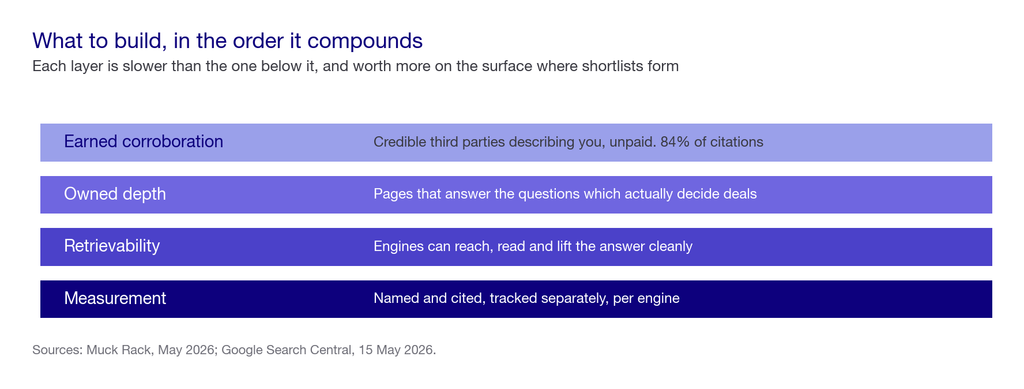
| Owned content with real depth | Front-loaded, then maintenance | Pages that keep producing after the brief is forgotten |
| Technical and retrievability work | Project cost, then periodic | Making sure engines can reach, read and lift your pages |
| Earned corroboration | The largest line item, and the slowest | Third-party sources describing you accurately, unpaid |
| Multi-engine tracking platform | Roughly $99 to $400 a month | Automated per-engine visibility and competitor share of voice |
| Platform plus a growth team | Custom | Pepper: tracking, plus the people and agents doing the work it points at |
The honest comparison is not cost per click against cost per article. It is what you still have in month twenty-four.
What nobody should promise you
That organic replaces paid. It does not capture existing demand as efficiently, and a business needing pipeline this quarter needs both.
A guaranteed citation, ranking or position in an AI answer. Nobody controls generated output.
A specific CAC multiple from switching to organic. The figures circulating on this topic do not trace to studies with stated samples and methods.
That organic results arrive on a paid timescale. They do not, and any proposal implying otherwise is setting up the wrong measurement window.
When paid is the right answer and organic is not
The answer that costs us the sale. If you need pipeline inside one quarter, have no existing content base, and cannot fund a build period, you do not need an organic programme yet and we would tell you to spend on paid instead.
Organic is an asset purchase with a lead time. Buying it under a one-quarter deadline produces a half-built asset and a disappointed team. Start it when you can fund the build, and use paid to hold the line meanwhile. That sequencing is not a compromise, it is the correct order.
Frequently asked questions
What is organic growth?
Organic growth is customer acquisition that does not require paying a platform per impression or click. It comes from search visibility, owned content, earned third-party reputation and referral, and the defining property is that the asset keeps producing after the work is finished.
What is the difference between organic growth and paid growth?
Paid rents access to someone else’s audience and stops the moment you stop paying. Organic builds assets you own, or reputation you have earned, which persist. Paid is better at capturing demand that already exists. Organic is better at becoming the answer when demand forms.
Is organic growth better than paid advertising?
Neither is better in general. Paid wins on speed and on capturing existing demand. Organic wins on persistence and on eligibility for AI citations, where paid content accounts for 0.3 percent against 84 percent for earned media.
Can I buy my way into AI search answers?
Not effectively. In a study of more than 25 million cited links across ChatGPT, Claude and Gemini, paid and advertorial content accounted for 0.3 percent of citations. Budget for being described accurately by credible third parties instead.
How long does organic growth take?
Plan on three monthly readings of a fixed prompt set before judging anything, so roughly 90 days for direction. Meaningful compounding takes longer. The account cited above reached 700 percent organic traffic growth over two years.
Should I stop paid advertising to fund organic?
Usually not. Paid captures demand that exists this quarter, which organic cannot do as quickly. The better move is to fund organic as an asset with its own measurement window while paid holds near-term pipeline.
How do I measure organic growth in AI search?
Track two numbers separately per engine: whether an engine names your brand, and whether it cites a page on your domain. The gap between them tells you whether you have an awareness problem or a citability problem, and they need different fixes.
What is the inbound marketing funnel?
It is the older name for this idea: attracting buyers with useful content rather than interrupting them with ads, then converting that attention over time. The mechanic is unchanged; what moved is that the top of the funnel now often happens inside an AI assistant.
Where to go next
Ask the one question that settles it for your own business: what would you still have in twelve months if you paused all spend today?
Then run the 30-prompt test and see whether you appear where your buyers now assemble their shortlist. Those two answers set the ratio better than any benchmark can.
Book a growth audit · Read the case studies · Explore Pepper’s platform
Sources and further reading
- Forrester. 2026 Buyers’ Journey Survey, published 21 January 2026. Nearly 18,000 global business buyers. Source of the 94, 55, 54 and 47 percent figures. Self-reported behaviour.
- Muck Rack. “What Is AI Reading?” May 2026. More than 25 million cited links across ChatGPT, Claude and Gemini, 17 industries. Source of the 84 percent earned media and 0.3 percent paid figures. Link
- Google Search Central. AI search optimisation guidance, 15 May 2026. Confirms AI Overviews and AI Mode run on core Search ranking systems with no separate AI index, and warns against guaranteed-ranking claims.
- Pepper. Apollo 24/7 case study, Acceldata case study and SalesHood case study. All figures as published on those pages.
- Pepper. E-E-A-T in the age of AI search, on how engines decide which sources to trust.
- Deliberately excluded: all organic-versus-paid CAC comparisons found on this topic, including specific dollar figures and the claim that acquisition costs rose 40 to 60 percent in two years. Every version traced to a marketing blog citing another marketing blog rather than to a study with a stated sample and method.
Latest Blogs
Choosing a GEO agency for mid-market B2B used to be a shortlisting problem. It is now a procurement problem, because the published prices have largely gone. Of four agencies publishing a GEO-specific figure in September 2026, two had withdrawn their pricing pages by early October and one had moved domains. Exactly one still publishes a number a mid-market buyer can act on. So the useful question is no longer which agency is best in the abstract, but how to compare three quotes when only one of them arrived with a method attached.
Third-party sources and AI citations are tightly linked, and the link stops short of where most plans assume. Off-page work decides whether an engine retrieves and cites you. It does not decide whether the answer names you, and 61.7% of brand appearances are citations with no name attached. The two largest 2026 datasets also disagree about how much of the citation surface is third-party at all, one saying 84% and the other putting the brand bucket above half. That disagreement is definitional rather than factual, and it decides where a budget goes.
Why is my competitor showing up in ChatGPT and not me? Before accepting the premise, check it. Across 3,981 brand appearances studied in 2026, 61.7% were citations with no brand name in the answer and only 13.2% produced both. So there are three states that look identical from where you are sitting: genuinely absent, present as an unnamed source, and named less often than a rival. Each has a different cause and a different fix, and working on the wrong one is the most common way this gets expensive.
Get your hands on the latest news!

Similar Posts

Digital Marketing
12 mins read
Does YouTube help AI visibility? What the citation data shows

Digital Marketing
15 mins read
How to improve organic search rankings in 2026
Digital Marketing
15 mins read