Your rankings held and your traffic fell. Here is what happened.

The short answer
Your rankings did not change. The page they sit on did.
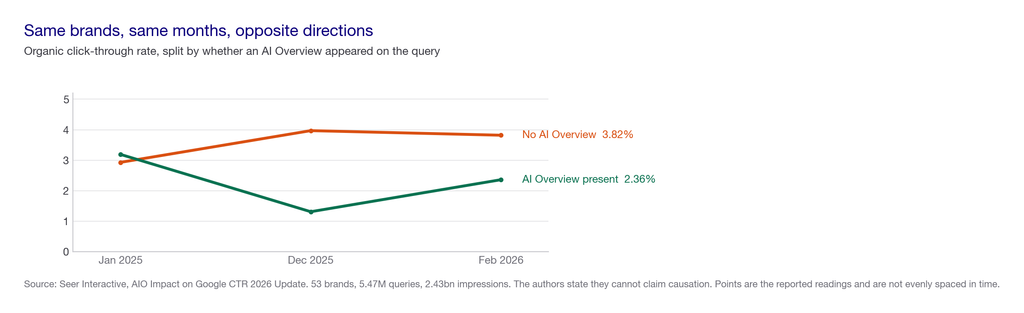
There is a clean way to see this. Seer Interactive tracked 53 brands, 5.47 million queries and 2.43 billion organic impressions from January 2025 to February 2026. They split the results by whether an AI Overview appeared.
- On queries with an AI Overview, click-through fell from 3.19 percent in January 2025 to 1.31 percent in December 2025, recovering to 2.36 percent by February 2026.
- On queries without one, click-through went the other way, rising from 2.93 percent to 3.97 percent and settling at 3.82 percent.
Same period. Same dataset. Opposite directions. That is about as close to a natural experiment as this industry gets. It means the problem is almost certainly not your content.
Key takeaways
- Position stopped being the thing that earns the click. Ranking first below an AI Overview is a lower-traffic position than ranking first used to be, and citation inside the answer is what now separates outcomes.
- Being cited inside the answer is now the variable. Across 2025, brands cited inside an AI Overview averaged 2.07 percent click-through against 0.94 percent for brands ranking on the same page uncited. Seer puts that at +120 percent more organic clicks per impression.
- The floor appears to have passed. AIO click-through rebounded from 1.31 to 2.36 percent in the first two months of 2026. Seer characterises that as levelling off rather than recovery.
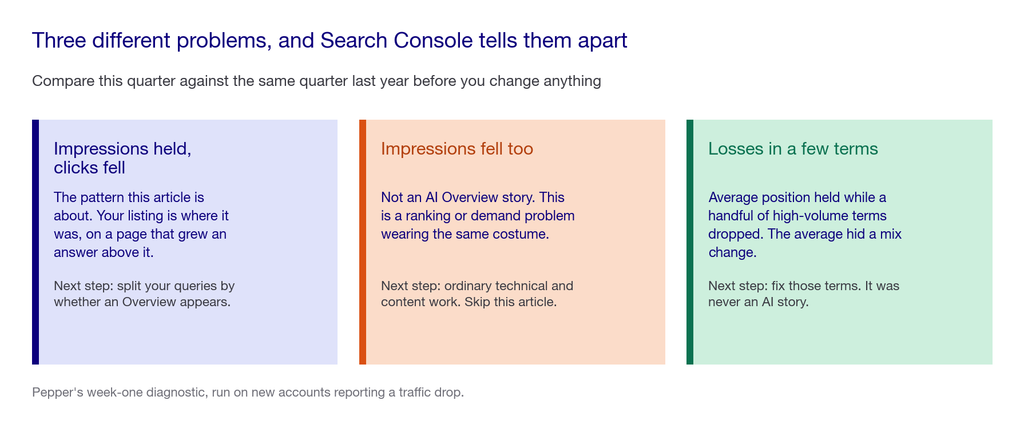
- Impressions holding while clicks fall is the signature. If impressions dropped too, you have a different problem. This article tells you which.
- The fix is not more posts. It is being the source the answer quotes, which is a different job from ranking.
Where this comes from. We run organic for more than 250 enterprises at Pepper and track over 10 million prompts across every major engine. This is the most common conversation we have on a new account. The diagnostic below is the one we actually run.
What is an organic traffic decline?
An organic traffic decline is a sustained fall in visits arriving from unpaid search. The version this article is about is narrower and more specific: clicks falling while position and impressions hold.
That combination is diagnostic. It rules out most of the usual suspects immediately:
- Not a ranking loss. Your position is unchanged, so you have not been outranked.
- Not a demand collapse. Impressions held, so people are still searching and still seeing you.
- Not a penalty or a core update hit. Both of those normally show up as impressions falling first.
What is left is the results page itself changing shape around a listing that did not move. If you want the broader framing, AEO vs SEO covers why the two run on the same systems.
What causes an organic traffic decline when rankings are stable?
Four things produce this pattern, and they are distinguishable in about twenty minutes using data you already have.
- An AI Overview now sits above you. Your listing is where it was, further down a longer page, below an answer that often satisfies the query. This is the most common cause in 2026, and the one the data above describes.
- Someone else is being cited in that answer and you are not. Same query, same Overview, different outcome. A cited brand keeps materially more of the click-through than an uncited one on the same page.
- The query mix underneath your average position changed. Average position is an average. Gain rankings on low-volume terms, lose them on your best one, and the number holds while the traffic does not.
- Intent moved off the results page entirely. For some questions the buyer asks an assistant and never runs the search. Both impressions and clicks fall together.
Only the first two are about AI Overviews. The third and fourth get misdiagnosed as AI constantly. That is why the diagnostic below separates them before you spend anything. We set out the measurement side in what to track and what to ignore.
See where you show up. Pepper’s GEO platform tracks Brand Visibility, Domain Prompt Presence and Share of Voice across ChatGPT, Perplexity, Gemini, Claude and Google AI Overviews. Your team can log in, connect Search Console and GA4, manage the prompt set and run your own agents in the Agent Atlas. A growth team works the same account alongside you. Book a growth audit or see where you show up.
The evidence, in one chart
The two lines below come from the same study, the same brands and the same months. The only difference is whether an AI Overview was present.
That divergence is the whole story. If your content had degraded, or a core update had hit you, you would expect both lines to fall. Instead the no-AIO line rose while the AIO line collapsed and partially recovered.
Read Seer’s own caveats before you use this. They state plainly that they cannot claim causation. They also cannot separate changes in cited impressions caused by Google from those caused by a brand’s own SEO work, without account-level investigation. And they note their model systematically underestimated organic click-through. Strong directional evidence, not a controlled experiment.
Citation is the new position
Here is the part that changes what you do on Monday.
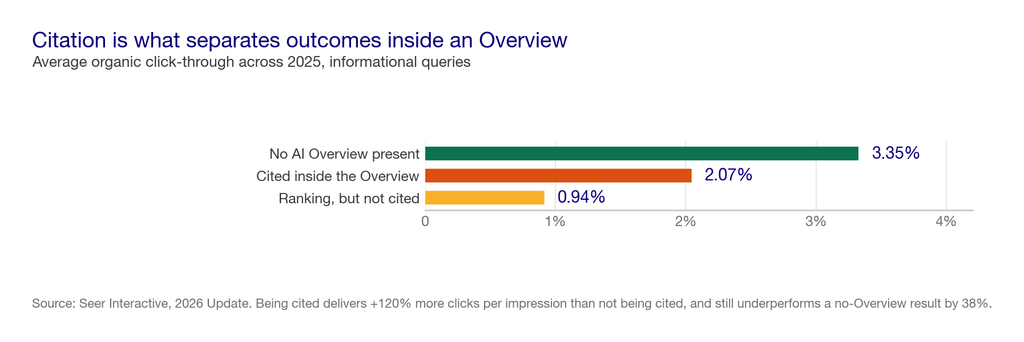
Within queries that returned an AI Overview, Seer separated brands cited inside the answer from brands that merely ranked on the same page. Across 2025, on informational queries:
- No AI Overview present: 3.35 percent average click-through.
- Cited inside the AI Overview: 2.07 percent.
- Not cited, ranking on the same page: 0.94 percent.
Two conclusions follow, and they point in different directions.
- Citation roughly doubles your clicks within an Overview. Seer states it directly: being cited delivers +120 percent more organic clicks per impression than not being cited. That is the argument for doing the work.
- Citation does not restore what you had. Even when cited, click-through still underperforms a no-Overview result by 38 percent. Uncited brands fared far worse, declining 67 percent across 2025 over 311 million impressions.
So citation is the variable you can influence, and it is not a cure. Anyone selling AI citation as a route back to your 2024 traffic is overselling it by roughly the width of that 38 percent gap.
What actually happened to the click
Google’s May 2026 guidance confirms the mechanism rather than a conspiracy. AI Overviews and AI Mode run on the core Search ranking and quality systems, with no separate AI index. Nothing was taken from you and given to someone else. The results page simply grew a layer above the results.
For scale, Conductor’s 2026 benchmarks across 13,770 domains and 21.9 million searches put AI Overview penetration at 25.11 percent of queries across all industries. Healthcare reaches 48.7 percent and financials 25.8 percent.
So in a typical category, roughly a quarter of your queries now sit under an answer, and in healthcare closer to half. That is the share of your footprint where the old relationship between position and clicks no longer holds.
The twenty-minute diagnosis
Do this before you commission anything. Everything here is free and uses data you already have.
- Step one: check impressions against clicks in Search Console. Compare this quarter to the same quarter last year. Impressions held and clicks fell? You are in the pattern this article describes. Impressions fell too? Your problem is ranking or demand, and the rest of this diagnostic will mislead you.
- Step two: split your queries by whether they return an AI Overview. Take your top thirty queries by impressions and run each one. Mark which return an AI Overview. You now have two cohorts.
- Step three: compare click-through between the cohorts. If the AIO cohort now has materially worse click-through than the non-AIO one, and both used to be similar, that is your answer. This mirrors the study above using your own data, which is what Seer themselves recommend.
- Step four: for the AIO cohort, check whether you are cited. Open each answer and read the sources. Being absent from an answer sitting above your own listing is the specific, fixable version of this problem.
- Step five: check the query mix underneath your average position. Sort by clicks lost. If a handful of high-volume terms account for most of the loss while average position held, the average was hiding a mix change. This was never an AI story.
Most teams we run this with find their loss concentrated in the AIO cohort, on queries where a competitor is cited and they are not. That is a content and authority problem with a known shape. Considerably better news than a mysterious decline. The mechanics of closing it are in how to structure content for AI citation and LLM seeding.
What this looked like on a real account
Not every site in this period lost clicks, which is worth saying because the category-level story implies everyone did.
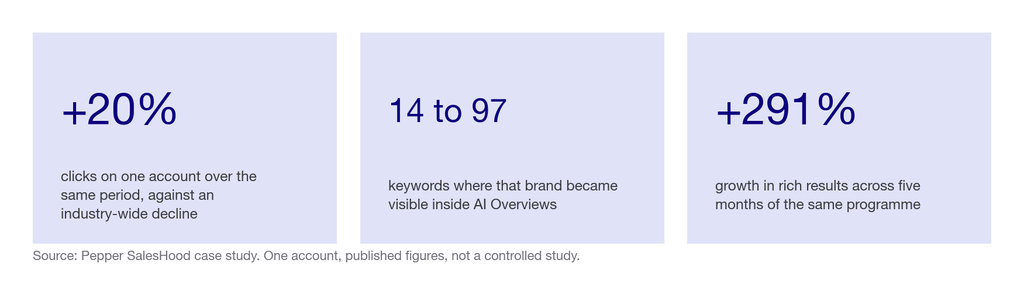
On SalesHood, across seven workstreams including a content engine of 20 new pieces and 8 refreshed, technical SEO resolving 10 issues, and GEO and AEO tracking in Atlas:
- Clicks rose 20 percent against an industry-wide decline over the same period.
- AI Overview visibility went from 14 keywords to 97, which is the citation half of the problem being solved directly.
- Blog impressions grew from 200,000 to 417,000.
- Rich results grew 291 percent in five months.
The sequence matters. The clicks did not recover because they published more. They recovered alongside a large rise in the number of AI Overviews the brand was cited in. That is the mechanism the Seer data points at.
Where this evidence is limited. One account, published on our own case study page, and not a controlled study. It shows the pattern is not inevitable. It does not prove your account would behave the same way.
Our methodology: how we weighted the causes
| Cause | Weight | Why it carries this much |
|---|---|---|
| AI Overview present above your listing | 40% | The largest measured effect, and the one with a clean AIO versus no-AIO comparison behind it |
| Not being cited inside that answer | 30% | Cited brands averaged 2.07% click-through against 0.94% uncited, a 120% difference per impression |
| Query mix change under a stable average position | 20% | Common, frequently misread as AI, and free to rule out |
| Intent moving off the results page | 10% | Real but hardest to measure, and it shows as impressions falling too |
The four causes at a glance
| Cause | What you see in Search Console | How to confirm it | Typical cost to address | Where it falls short |
|---|---|---|---|---|
| AI Overview above you | Impressions flat, clicks down, position flat | Run your top queries and mark which return an AIO | Content and authority work, months not weeks | You cannot remove the Overview, only get into it |
| Cited competitor, uncited you | Same as above, concentrated on specific queries | Open the answers and read the source list | The largest line item, and the slowest | Citation roughly doubles clicks within an Overview, and still runs 38% below no-Overview |
| Query mix change | Average position flat, clicks concentrated in a few losses | Sort by clicks lost, compare against position per query | Standard SEO work on the specific terms | Nothing to do with AI, and often the real answer |
| Intent left the SERP | Impressions down as well as clicks | Check whether the query still has search volume | Reaching the assistant instead, roughly $99 to $400 a month to track | Hardest to prove, and easy to blame for everything else |
How to choose what to fix first
The diagnosis decides this, not the budget. Run the twenty minutes first.
The scorecard
Score your situation out of 100 to work out where the loss actually sits.
| Signal | Weight | How to score it honestly |
|---|---|---|
| Loss concentrated in the AIO cohort | 35% | Your queries returning an AI Overview show materially worse click-through than those that do not |
| Absent from answers above you | 30% | On the losing queries, you are not in the source list and a competitor is |
| Impressions genuinely held | 20% | Confirms this is a click problem rather than a ranking or demand problem |
| Average position hiding a mix change | 10% | Your losses are spread rather than concentrated in a few high-volume terms |
| Extractability of the losing pages | 5% | The answer sits in the first two sentences under a real question heading |
The live test, over 90 days
Fix 30 prompts covering the queries you actually lost clicks on, phrased the way a buyer would type them. Real questions, such as “why are my clicks down but my rankings the same”, “what is the best data observability platform”, “how do I measure AI search visibility” and “which sales enablement tool suits mid-market teams”.
Run them across Google, ChatGPT and Perplexity, and log three things: whether an AI Overview appears, whether you are named, and whether a page on your domain is cited.
Rerun the identical set monthly for 90 days. Three readings is the shortest honest window: one is a snapshot, two could be noise, three shows direction. Keep the set fixed, because changing it resets the comparison.
Watch the citation column rather than the traffic column. Citations move first, and traffic follows or it does not.
Weak approach versus strong approach
The weaker approach: see traffic fall and assume the content went stale. Commission a refresh of the twenty pages that lost the most, republish with new dates, then watch nothing change. The pages were never the problem.
The stronger approach: split the losing queries by AI Overview presence, confirm the loss is concentrated there, read the source lists on the answers you are missing from, and work those sources.
The weak version treats a change in the results page as a change in your content quality. It is the most expensive misdiagnosis in this category, and we are called in to reverse it regularly.
Red flags
- Anyone diagnosing this without opening Search Console. The impressions-versus-clicks split decides which problem you have. It takes two minutes.
- A content refresh proposed before the query split. Refreshing pages that lost clicks to an Overview changes nothing about the Overview.
- Promises to restore your previous traffic. Cited brands still declined through 2025. Nobody can promise you 2024 numbers back.
- The 61 percent and 58 percent decline figures quoted without a source. Both circulate widely with no traceable sample or method.
- Publishing more as the answer. Volume does not get you into an answer that already exists. Depth and corroboration might.
- Guaranteed citations or rankings. Nobody controls generated output, and Google warns against providers guaranteeing rankings.
Five questions worth asking
- “Did our impressions hold?” This single number decides which of four problems you have.
- “What proportion of our lost clicks came from queries with an AI Overview?” If nobody has split the data, the diagnosis is a guess.
- “On those queries, who is cited instead of us?” That list is the work.
- “What would you do if this is a query mix change rather than AI?” A good partner has already ruled it out.
- “What are you not going to do?” A refresh of everything is the default answer and usually the wrong one.
Reduced to one principle: split your queries by whether an Overview appears before you change anything.
One closing note that costs us something. If your impressions fell alongside your clicks, this is not an AI Overview story. A GEO programme is not your fix, ours included. That case needs ordinary ranking and demand work, and we would tell you so rather than sell you the fashionable diagnosis.
What does fixing this cost?
| What you are buying | Typical 2026 cost | What it covers |
|---|---|---|
| The twenty-minute diagnosis | Free | Search Console data you already have, plus running thirty queries by hand |
| Ongoing manual tracking | Free, about two hours a month | 30 prompts across three engines, AIO presence and citation logged |
| Extractability pass on losing pages | Roughly a day of editing per page | Answer-led structure so a page can be lifted into an answer |
| Content depth on the losing topics | Front-loaded, then maintenance | Pages worth quoting rather than pages that merely rank |
| Earned corroboration | The largest line item, and the slowest | Getting the sources those answers already cite to describe you accurately |
| Multi-engine tracking platform | Roughly $99 to $400 a month | Automated per-engine visibility and competitor share of voice |
| Platform plus a growth team | Custom | Pepper: tracking, plus the people and agents doing the work it points at |
The first two rows are free, and they are the two that decide whether the rest of the table is relevant to you at all.
What nobody should promise you
That your previous traffic can be restored. Even cited inside an AI Overview, click-through runs about 38 percent below a result with no Overview. The old volumes are not a target anyone can commit to.
That refreshing your content fixes an Overview above it. The Overview is a change to the results page, not a verdict on your page.
A specific percentage recovery. The figures circulating on this topic mostly lack a traceable sample and method.
A guaranteed citation or ranking. Nobody controls generated output, and Google explicitly warns against providers who guarantee rankings.
When this is not your problem
The answer that costs us the sale. If your impressions fell alongside your clicks, you do not need an AI search programme yet and we would tell you not to buy one. You have a ranking or demand problem, and it needs ordinary technical and content work first.
Equally, if your losses sit in three high-volume terms while average position held, this was a query mix change. Fix those three terms. Cheaper, faster and more likely to work than anything else on this page.
Frequently asked questions
Why are my clicks down but my rankings the same?
Most often because an AI Overview now sits above your listing. On queries returning one, click-through fell from 3.19 percent to 1.31 percent through 2025. On queries without one, it rose from 2.93 to 3.97 percent over the same period.
How do I know if AI Overviews caused my traffic decline?
Check whether impressions held while clicks fell. Then split your top thirty queries by whether they return an AI Overview, and compare click-through between the groups. If the loss concentrates in the AIO group, you have your answer.
Does being cited in an AI Overview protect my clicks?
Partly. Across 2025 cited brands averaged 2.07 percent click-through against 0.94 percent for uncited brands, which Seer puts at 120 percent more clicks per impression. Even cited, though, click-through still runs 38 percent below a result with no Overview at all.
Are organic click-through rates recovering?
There are early signs. Click-through on AI Overview queries rebounded from 1.31 percent in December 2025 to 2.36 percent in February 2026. The researchers describe that as levelling off rather than a genuine recovery.
How many searches have an AI Overview?
About 25.11 percent across all industries, per Conductor’s 2026 benchmarks across 13,770 domains and 21.9 million searches. Healthcare is the heaviest category at 48.7 percent and financials sit at 25.8 percent.
Should I refresh my content to fix falling clicks?
Only after you have confirmed the cause. Refreshing a page that lost clicks to an AI Overview does not change the Overview. This is the most expensive misdiagnosis we are asked to reverse.
My impressions fell too. Is that the same problem?
No, and the distinction decides your whole plan. Impressions falling alongside clicks points to a ranking or demand problem rather than an AI Overview problem. The fixes are different, and an AI search programme will not address it.
Can I stop my content appearing in AI Overviews?
You can block crawlers, but that removes you from the answer while the Overview still appears for everyone else. You lose the citation and keep the click loss. That is the worst of both outcomes.
Where to go next
Open Search Console and compare impressions against clicks for the same quarter last year. That one comparison tells you which of four problems you have, and it takes two minutes.
If impressions held, split your top thirty queries by AI Overview presence. Do that before approving any content work.
Learn AI Search · Book a growth audit · Read the case studies
Sources and further reading
- Seer Interactive. “AIO Impact on Google CTR: 2026 Update.” 53 brands, 5.47 million queries, 2.43 billion organic impressions, January 2025 to February 2026. AI Overview present: 3.19 percent in January 2025, 1.31 percent in December 2025, 2.36 percent in February 2026. No AI Overview present: 2.93 percent, 3.97 percent and 3.82 percent over the same points. On informational queries across 2025, average click-through was 3.35 percent with no Overview, 2.07 percent when cited inside one, and 0.94 percent when ranking on the same page uncited, which Seer describes as being cited delivering 120 percent more organic clicks per impression while still underperforming a no-Overview result by 38 percent. Uncited brands declined 67 percent across 2025 over 311 million impressions. The authors state they cannot claim causation, cannot separate Google-driven from brand-driven changes in cited impressions without account-level investigation, and that their model systematically underestimated organic click-through. Link
- Conductor. 2026 AEO and GEO benchmarks. 13,770 domains and 21.9 million searches. Source of the 25.11 percent all-industry, 48.7 percent healthcare and 25.8 percent financials figures.
- Google Search Central. AI search optimisation guidance, 15 May 2026. Confirms AI Overviews and AI Mode run on core Search ranking and quality systems with no separate AI index, and warns against guaranteed-ranking claims.
- Pepper. SalesHood case study. Figures as published on the page.
- Pepper. How to get cited in AI Overviews and how to measure AI search visibility without expensive tools.
- Deliberately excluded: the “58 percent click-through decline on top-ranking pages” and “AI Overviews cut organic click-through by 61 percent” figures. Both circulate widely without a traceable sample and method, and the Seer dataset answers the same question with its scope published.
Latest Blogs
Most advice on this is inference dressed as fact. OpenAI documents exactly one thing clearly, which is access. Here is what is documented, what is inferred, and how to verify the rest for yourself.
Being named in an AI answer and having your page used as its source are different outcomes with different causes and different fixes. The gap between them is the most useful diagnostic in AI search, and most reporting collapses it into one number.
Every platform reports share of voice and almost none of them define it the same way. Here is the definition worth using, the three choices that change the number, and how to measure it yourself without buying anything.
Get your hands on the latest news!

Similar Posts

Artificial Intelligence
3 mins read
Knowledge Panel: Google’s Gold Star for Your Brand

Artificial Intelligence
3 mins read
Entity Recognition: Teaching Search Engines to Read Like Humans

Artificial Intelligence
3 mins read