Is content marketing still effective when AI answers first?

The short answer
Yes, and the question is usually being asked with the wrong number in hand.
Most people asking whether content marketing still works are looking at a traffic chart. That chart measures the old job. The new job is being the source an engine quotes. On that measure, content is doing more work than it ever has.
Key takeaways
- 84 percent of AI citations come from earned media, meaning content somebody published. Paid and advertorial content accounts for 0.3 percent.
- You cannot buy the position content earns. That single comparison is the whole argument for the channel, and it did not exist two years ago.
- Clicks are one payoff among several now, and they have not vanished. On one Pepper account, clicks rose 20 percent while the wider category declined.
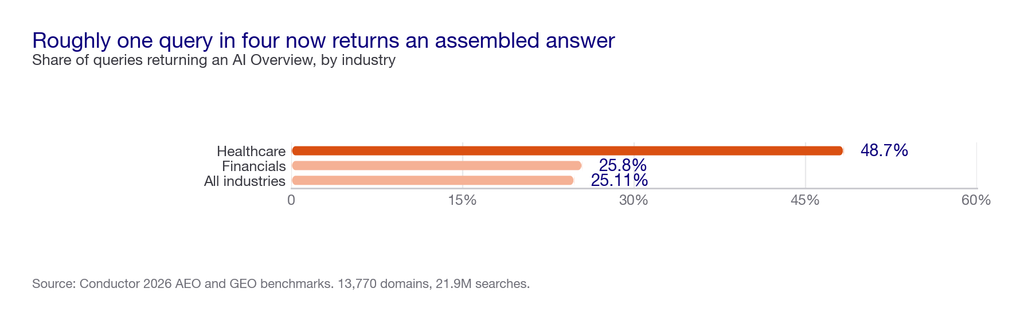
- The reach is real and uneven. AI Overviews appear on 25.11 percent of queries across all industries, and 48.7 percent in healthcare.
- What changed is the measurement, not the effectiveness. Judge content on sessions alone and you will defund the thing winning you the answer.
Where this comes from. We run organic for more than 250 enterprises at Pepper and track over 10 million prompts across every major engine. We sell content and organic, so read the argument with that in mind. Every figure below comes from a primary source you can check rather than from us.
What is content marketing now?
The old definition: publishing useful material to attract an audience you can sell to, rather than interrupting one someone else assembled.
That definition still holds. What changed is where the material gets consumed and what counts as it working.
- The old job was earning the visit. Someone searched, clicked, read, and entered a funnel you could watch in analytics.
- The new job is being the source. Someone asks an assistant. It composes an answer from several sources, and your material either shapes it or does not. Often nobody clicks anything.
- Both jobs are live at once. This is the part most articles get wrong in one direction or the other. Traffic did not disappear. It is also no longer the whole scoreboard.
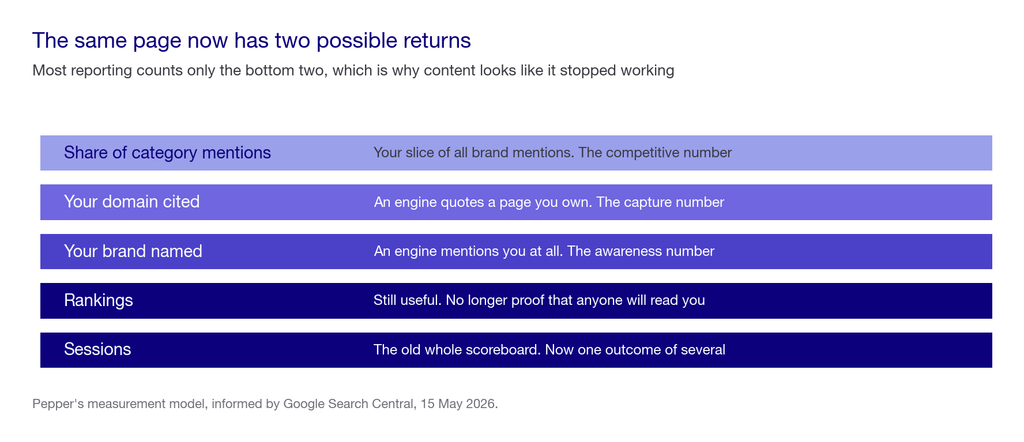
The practical consequence is that the same page now has two possible returns, and most reporting only counts one of them.
See where you show up. Pepper’s GEO platform tracks Brand Visibility, Domain Prompt Presence and Share of Voice across ChatGPT, Perplexity, Gemini, Claude and Google AI Overviews. Your team can log in, connect Search Console and GA4, manage the prompt set and run your own agents in the Agent Atlas. A growth team works the same account alongside you. Book a growth audit or see where you show up.
The number that settles the argument
Muck Rack analysed more than 25 million cited links across ChatGPT, Claude and Gemini in May 2026.
- Earned media accounted for 84 percent of AI citations. That means material somebody wrote and published, then credible third parties carried.
- Journalism alone accounted for 27 percent, the single largest category inside that share.
- Paid and advertorial content accounted for 0.3 percent.
Sit with the last figure. The channel you can simply buy is almost absent from the surface where answers get composed. The channel you have to earn takes almost all of it.
If content marketing were becoming less effective, you would expect the reverse.
How much of search this actually touches
Reach varies enormously by category, and the averages hide it.
Conductor’s 2026 benchmarks drew on 13,770 domains and 21.9 million searches. They put AI Overview penetration at 25.11 percent across all industries. Healthcare reaches 48.7 percent, the heaviest category measured, and financials sit at 25.8 percent.
So in a typical category roughly one query in four now returns an assembled answer, and in healthcare it is closer to one in two. That is the share of your audience for whom the old click model is already partly obsolete.
Google’s May 2026 guidance explains why your existing work still counts. AI Overviews and AI Mode run on core Search ranking and quality systems, with no separate AI index. The content you publish for search is the content drawn on for answers. There is no second programme to fund.
What the buying journey looks like now
Forrester’s 2026 Buyers’ Journey Survey, published 21 January 2026 and covering nearly 18,000 global business buyers, found:
- 94 percent used AI somewhere in a recent purchase process.
- 55 percent compared vendors inside AI tools directly.
- 54 percent researched products there.
- 47 percent built the internal business case with them.
Self-reported, so read the ordering as firmer than the exact levels. The direction is not ambiguous. A large share of evaluation now happens somewhere your analytics cannot see, drawing on material that 84 percent of the time somebody earned rather than bought.
What this looks like on real accounts
Three programmes, three different things content actually returned.
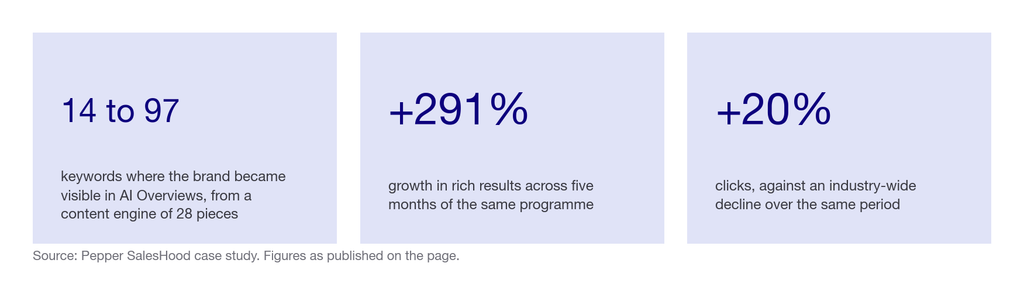
Citations and visibility. On SalesHood, a content engine of 20 new pieces and 8 refreshed ran alongside technical fixes and tracking. AI Overview visibility went from 14 keywords to 97. Blog impressions rose from 200,000 to 417,000, rich results grew 291 percent in five months, and clicks rose 20 percent against an industry-wide decline. Their CMO, Elay Cohen, described seeing a direct connection between the investment and closed deals originating from LLMs.
Depth over volume. On one data-observability account, organic traffic grew 6X, top-three keyword rankings went from 85 to more than 300, and a single hero guide produced more than 260,000 impressions on its own. One page outperformed a quarter of the scheduled calendar. That is the clearest argument against publishing for cadence.
Revenue, over a longer horizon. On an enterprise healthcare account, a two-year programme built on 400 doctor-authored blogs and 200 expert-authored articles produced 700 percent organic traffic growth and a 177 percent increase in revenue attributed to organic search.
Where this evidence is limited. These are our own published client results across three industries and two markets. They are not a controlled study and we would not present them as one. What they show is that the payoff still arrives, in three different shapes.
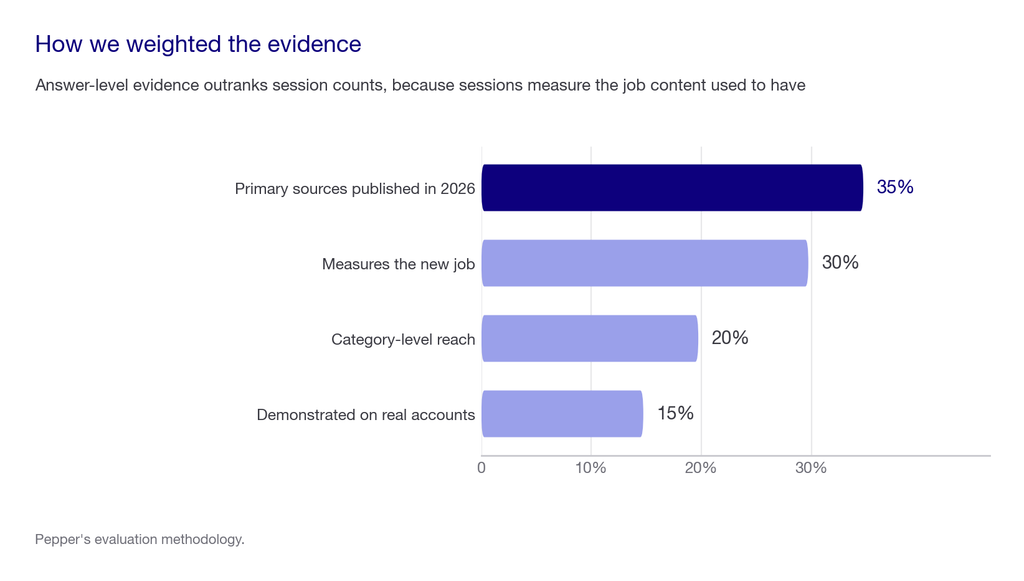
Our methodology: how we weighted the evidence
| Criterion | Weight | What that means here |
|---|---|---|
| Primary sources published in 2026 | 35% | Every figure traced to a named study with a stated sample, not to a marketing blog |
| Measures the new job, not the old one | 30% | Citation and answer-level evidence outranks session counts, because sessions measure the job content used to have |
| Category-level reach | 20% | How much of search this actually touches, stated by industry rather than as one average |
| Demonstrated on real accounts | 15% | We can point at a published client result |
**What we could not verify and left out.** Several figures that recur across this topic: that zero-click searches are 68 percent of all Google searches, that AI Overviews cut position-one click-through by 58 percent, that blog-prioritising marketers are 13 times more likely to see positive return, and that original research lifts conversion by 64 percent. Each traces to a marketing blog or an undated aggregation rather than a study with a stated sample and method.
Content marketing at a glance: old scoreboard against new
| What you are measuring | The old job | The new job | Typical cost to improve | Where it falls short |
|---|---|---|---|---|
| Sessions | The whole scoreboard | One outcome of several | Content production cost | Undercounts every answer where nobody clicked |
| Rankings | The leading indicator | Still useful, no longer sufficient | Standard content and technical work | Ranking well does not mean being quoted |
| Brand named in answers | Not measured | The awareness number | Free to check manually, or roughly $99 to $400 a month | Being named is not being cited |
| Your domain cited in answers | Not measured | The capture number | Same tracking, different column | Requires content an engine can lift cleanly |
| Share of category mentions | Not measured | The competitive number | Platform tracking | Yours can rise while this falls if rivals rose faster |
| Revenue attributed to organic | The end goal | Still the end goal | Analytics configuration | Attribution misses answers that never produced a click |
—
How to choose what to measure and fund
The budget question and the measurement question are the same question. Fix the second and the first answers itself.
The scorecard
Score your current content programme out of 100.
| Area | Weight | How to score it honestly |
|---|---|---|
| Answer-level measurement | 30% | You track whether engines name you and whether they cite your domain, as two separate numbers, per engine |
| Depth over cadence | 25% | Your best pages genuinely own their question, rather than covering it to a word count |
| Earned corroboration | 20% | Credible third parties describe you accurately without payment, and you can name three |
| Extractability | 15% | Headings are real questions, answers come in the first two sentences, tables are text not images |
| Reporting that matches the job | 10% | Your monthly report contains at least one answer-level number, not only sessions and rankings |
The live test, over 90 days
Fix 30 prompts your buyers would actually type, and run them across Google, ChatGPT and Perplexity. Real questions, such as “is content marketing still effective”, “what is the best data observability platform”, “how do I measure AI search visibility” and “which sales enablement tool suits mid-market teams”.
Log two things separately for every prompt: whether the engine names you, and whether it cites a page on your domain. Rerun the identical set monthly for 90 days.
Three readings is the shortest honest window: one is a snapshot, two could be noise, three shows direction. Keep the prompt set fixed, because changing it resets the comparison.
Then put that alongside your traffic chart. In most accounts we run, the two lines tell different stories, and the answer-level one is the one moving.
Weak approach versus strong approach
The weaker approach: watch sessions fall, conclude content is not working, then cut the budget while still publishing at a lower cadence. You lose the citations too. This is the most common sequence we are called in to reverse.
The stronger approach: add two answer-level numbers to the monthly report, keep funding depth on fewer subjects, and judge the programme on whether you are being named and cited as well as visited.
The difference is not effort or spend. It is whether the report you defend the budget with measures the job content now does.
Red flags
- A content proposal with no answer-level measurement. It will be judged on the metric falling for structural reasons, and it will lose that argument.
- Volume commitments as the headline. Pieces per month is an input, and depth is what earns the citation.
- Nothing off your own domain. 84 percent of citations come from sources you do not own, so an on-domain-only plan addresses the minority of the signal.
- Paid placement sold as authority. Paid and advertorial content is 0.3 percent of AI citations.
- A single blended visibility score. It hides the gap between being named and being cited, which is the diagnostic.
- Guaranteed citations or rankings. Nobody controls generated output, and Google warns against providers guaranteeing rankings.
Five questions worth asking
- “Which two numbers will tell us this is working, other than sessions?” If there is no answer, the programme is set up to fail its own review.
- “How much of this scope is off our domain?” If none, it addresses the minority of the citation signal.
- “Show me a query where a competitor is cited and explain why.” Separates retrieval understanding from production capacity.
- “What would you stop publishing?” A good partner cuts something to fund depth.
- “What does this look like if clicks keep falling?” The honest answer names the citations, not a promise that traffic recovers.
Reduced to one principle: measure whether you are the answer, as well as whether you got the visit.
One closing note that costs us something. We sell content, so we are the least neutral party you will read on this. Every agency’s recommendation matches what it sells, ours included. The figures here all come from sources you can open yourself, which is the only useful defence against that.
What does this cost?
| What you are buying | Typical 2026 cost | What it covers |
|---|---|---|
| Search Console and Bing Webmaster Tools | Free | First-party reporting, including generative AI performance data |
| Manual answer-level tracking | Free, about two hours a month | 30 prompts across three engines, named and cited logged separately |
| Content with genuine depth | Front-loaded, then maintenance | Pages that own a question rather than cover it |
| Extractability pass on existing pages | Roughly a day of editing per page | Turning ranked pages into quotable ones |
| Earned corroboration | The largest line item, and the slowest | Third parties describing you accurately, unpaid |
| Multi-engine tracking platform | Roughly $99 to $400 a month | Automated per-engine visibility and competitor share of voice |
| Platform plus a growth team | Custom | Pepper: tracking, plus the people and agents doing the work it points at |
The cheapest row on this table is the one that changes the budget conversation, and most teams have not switched it on.
What nobody should promise you
That content marketing restores the traffic you had before AI answers. Some of those clicks are structurally gone, and a proposal implying otherwise is setting up a failure.
A guaranteed citation or position in an AI answer. Nobody controls generated output.
A specific return multiple from content. The figures circulating on this topic trace to marketing blogs rather than studies with stated samples.
That publishing more will fix it. Depth earns citations. Volume fills a calendar, and the two are frequently in tension.
When content marketing is not your answer
The answer that costs us the sale. If you need pipeline inside one quarter and have no existing content base, you do not need a content marketing programme yet and we would tell you not to buy one. Spend on demand capture instead.
Content is an asset purchase with a lead time. Compounding needs time it does not have if the target is ninety days. Start it when you can fund the build, run paid meanwhile, and do not judge the programme on the quarter it began in.
Frequently asked questions
Is content marketing still effective in 2026?
Yes, though it is usually measured on the wrong number. Content earns 84 percent of AI citations while paid and advertorial earns 0.3 percent. On the surface where answers get composed, it is doing more work than before.
Does content marketing still drive traffic?
Sometimes, and less predictably than it did. One programme we ran saw clicks rise 20 percent while its category declined, so traffic has not vanished. It is one payoff among several now, and sessions alone undercount it.
How many searches actually return an AI answer?
AI Overviews appear on 25.11 percent of queries across all industries, according to Conductor’s 2026 benchmarks across 13,770 domains and 21.9 million searches. Healthcare is the heaviest category at 48.7 percent, and financials sit at 25.8 percent.
Should I publish more content or better content?
Better, on fewer subjects. On one account a single hero guide produced more than 260,000 impressions, outperforming a quarter of the scheduled calendar. Depth is what makes a page worth quoting.
How do I measure content marketing now?
Keep sessions and rankings, then add two answer-level numbers per engine. Whether the engine names your brand, and whether it cites a page on your domain. The gap tells you whether the problem is awareness or extractability.
Can I pay to appear in AI answers instead?
Not effectively. Paid and advertorial content accounted for 0.3 percent of AI citations in a study of more than 25 million cited links, against 84 percent for earned media.
Do I need a separate content programme for AI search?
No. Google confirmed in May 2026 that AI Overviews and AI Mode run on core Search ranking systems with no separate AI index, so the content you publish for search is the content being drawn on for answers.
How long before content marketing shows results?
Plan on three monthly readings of a fixed prompt set for direction, so roughly 90 days. Substantial compounding takes longer. The two-year programme cited above reached 700 percent organic traffic growth and a 177 percent rise in revenue attributed to organic search.
Where to go next
Add two columns to your next content report: whether engines name you, and whether they cite you. Both are free to check by hand for thirty prompts.
Put those beside your traffic chart. If traffic is falling while the answer-level lines rise, you do not have a content problem. You have a reporting problem.
Learn AI Search · Book a growth audit · Read the case studies
Sources and further reading
- Muck Rack. “What Is AI Reading?” May 2026. More than 25 million cited links across ChatGPT, Claude and Gemini, 17 industries. Source of the 84 percent earned media, 27 percent journalism and 0.3 percent paid figures. Link
- Conductor. 2026 AEO and GEO benchmarks. 13,770 domains and 21.9 million searches. Source of the 25.11 percent all-industry, 48.7 percent healthcare and 25.8 percent financials figures.
- Forrester. 2026 Buyers’ Journey Survey, published 21 January 2026. Nearly 18,000 global business buyers, self-reported. Source of the 94, 55, 54 and 47 percent figures.
- Google Search Central. AI search optimisation guidance, 15 May 2026. Confirms AI Overviews and AI Mode run on core Search ranking systems with no separate AI index, and warns against guaranteed-ranking claims.
- Pepper case studies, all figures as published: the SalesHood programme, Acceldata and Apollo 24/7.
- Pepper. Organic growth vs paid and how to structure content for AI citation.
- Deliberately excluded: the 68 percent zero-click figure, the 58 percent click-through decline, the 13x return claim and the 64 percent conversion lift from original research. Each traces to a marketing blog or an undated aggregation rather than a study with a stated sample and method.
Latest Blogs
Most advice on this is inference dressed as fact. OpenAI documents exactly one thing clearly, which is access. Here is what is documented, what is inferred, and how to verify the rest for yourself.
Being named in an AI answer and having your page used as its source are different outcomes with different causes and different fixes. The gap between them is the most useful diagnostic in AI search, and most reporting collapses it into one number.
Every platform reports share of voice and almost none of them define it the same way. Here is the definition worth using, the three choices that change the number, and how to measure it yourself without buying anything.
Get your hands on the latest news!

Similar Posts

Content Marketing
12 mins read
E-E-A-T in the age of AI search: how engines decide which brands to trust
Advertising
9 mins read
LinkedIn Posts vs. LinkedIn Pulse: What Actually Gets Indexed by LLMs

Content Marketing
5 mins read