What is zero-click search, and what does it mean for your traffic?
The short answer
Zero-click search is when a person gets their answer on the results page or inside an AI assistant and never visits a site. Zero-click search is real, and the headline statistic about it is misleading. Clickthrough rates fell mostly because impressions inflated, not because clicks disappeared. Where traffic genuinely has dropped, the clicks are not arriving at AI engines either, so the honest framing is evaporation rather than migration.
Key takeaways
- Zero-click means the answer was delivered without a visit. Featured snippets did this first. AI Overviews and assistants do it at far greater scale.
- The clickthrough collapse is largely arithmetic. Across 53 brands and 5.47 million queries, clicks were essentially flat at 398,000 to 400,000 in the sharpest month while impressions more than doubled from 15.8 million to 33.1 million.
- So your clickthrough rate can fall while nothing about your performance changed. Report it without impressions beside it and you will report a decline you did not cause.
- It is also recovering. Organic clickthrough on queries with an AI Overview rose from 1.31% in December 2025 to 2.36% in February 2026.
- Paid never moved. Paid clickthrough on the same AI Overview queries held between 13.99% and 17.95% across the year, which is hard to square with the idea that AI Overviews destroy the click.
- Where traffic genuinely fell, it did not go to AI. One 2026 study of 74 sites found organic down 20.3% year on year, with AI referrals tripling and still under 1% of total traffic.
- Pepper is an agentic organic growth engine and an organic growth partner. Agent Atlas puts the agents in your team’s hands. Pepper’s GEO platform reports Brand Visibility, Domain Prompt Presence and Share of Voice. A growth team works alongside yours. Eight years, more than 250 enterprises, more than 10 million tracked prompts.
A note on where this comes from. I look at organic through a revenue lens, and zero-click is the subject where the gap between the panic and the evidence is widest. Pepper runs organic for more than 250 enterprises over eight years and tracks more than 10 million prompts across every major engine. The single most common reporting error I see is a clickthrough chart with no impression line next to it.
Disclosure: Pepper sells services that help brands appear inside AI answers, so a story about clicks disappearing suits us commercially. The evidence below is more qualified than that story, and we have reported it as we found it. Every figure is traced to a named study with its sample size. Competitors are named but never linked.
What is zero-click search?
Zero-click search is any search where the person gets what they needed without visiting a website. The answer appears on the results page itself, or inside an AI assistant, and the journey ends there.
It is not new. Featured snippets, knowledge panels, weather boxes and currency converters have all answered questions in place for years. What changed is scale and scope: an AI Overview or an assistant can answer a complex, multi-part commercial question that previously required visiting three sites.
Two distinctions matter more than the definition.
- Zero-click is not the same as invisible. If the answer names your brand or cites your page, you were present at the decisive moment even though nothing arrived in your analytics. Our piece on zero-click versus AI citation covers that reframe properly.
- Zero-click is not the same as a clickthrough decline. The two are related and they are measured differently, and conflating them is the source of most of the bad numbers in circulation.
The statistic everyone quotes, and what it actually says
You have seen a version of it: AI Overviews cut organic clickthrough by around 60%. It is quoted in most decks about this subject, and it is a misreading of a good study.
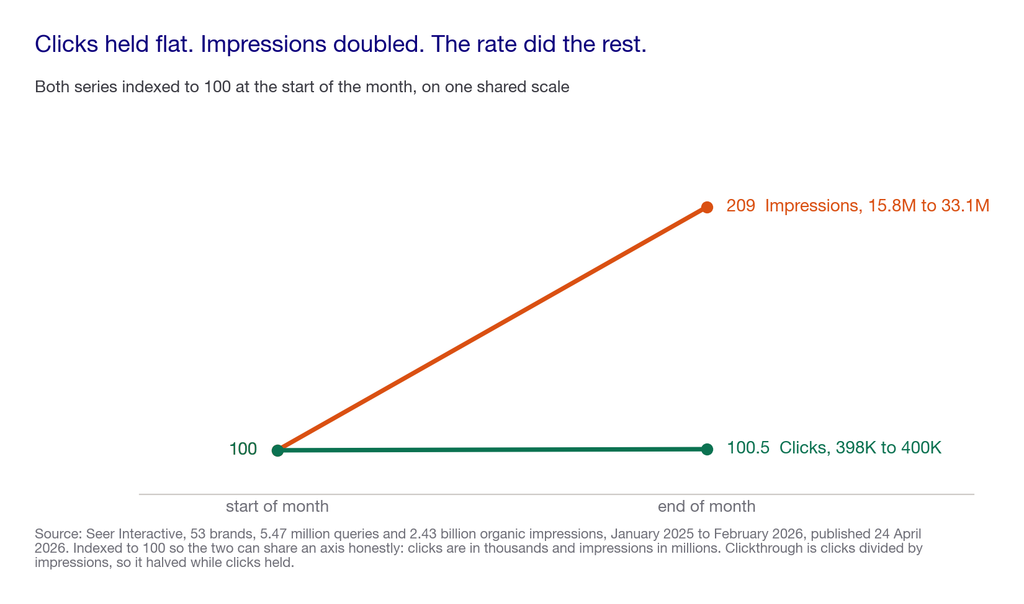
The analysis covers 53 brands, 5.47 million queries and 2.43 billion organic impressions from January 2025 to February 2026. In the month where the effect was sharpest, the authors report clicks essentially flat, moving from 398,000 to 400,000, while impressions more than doubled from 15.8 million to 33.1 million.
Clickthrough rate is clicks divided by impressions. Hold the numerator still, double the denominator, and the rate halves. Nothing about performance changed.
Two further findings from the same study are almost never quoted.
- Clickthrough on AI Overview queries recovered from 1.31% in December 2025 to 2.36% in February 2026, a rise of roughly 80% in three months.
- Paid clickthrough on those same queries held between 13.99% and 17.95% all year, with no meaningful decline. If AI Overviews were destroying the click, paid results on the same queries would have moved too.
What this means for your reporting. Your impressions are inflating faster than your clicks, so your clickthrough rate will keep falling even in a good quarter. Never report clickthrough without impressions beside it, and never let a clickthrough chart alone trigger a strategy change.
Where it falls short: this is one analysis of 53 brands, weighted toward companies buying enterprise search tooling, and the clicks-versus-impressions comparison is one month rather than the whole dataset. We quote it because the authors published the underlying numbers, which most people citing their headline did not read.
If you want to know whether your own clickthrough decline is real or arithmetic, book a growth audit and we will separate the two with you.
Where the clicks actually went
Clickthrough being an artefact does not mean traffic is fine. In aggregate it is not, and the direction of the loss is the surprising part.
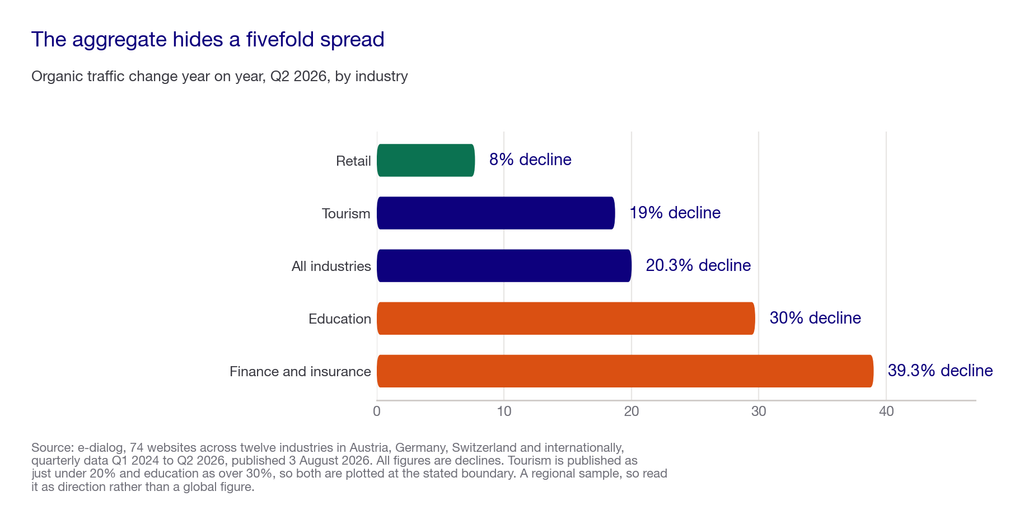
An analysis of 74 websites across twelve industries in Austria, Germany, Switzerland and internationally, covering quarterly data from Q1 2024 to Q2 2026, found organic traffic down 20.3% year on year in the second quarter of 2026.
The spread is wide. Finance and insurance fell 39.3%. Education fell over 30%. Tourism fell just under 20%. Retail fell 8.0%.
And the destination is the finding. In the same dataset, AI referral traffic tripled over the period and still accounts for less than one percent of total traffic. A separate peer-reviewed study of 973 e-commerce sites puts AI referrals at under 0.2% of all visits.
So the comforting story, that the clicks have moved somewhere you are not yet measuring, does not hold. They are not arriving anywhere. The demand is being satisfied without a visit.
Where it falls short: 74 sites is a real sample but a regional one, weighted to German-speaking Europe, and one study is not a census. Read it as a strong signal on direction rather than a precise global figure, and run the same comparison on your own Search Console data before acting on it.
How we weighted the evidence
Four criteria, fixed before we gathered anything. They are our priorities, not measured coefficients.
| Criterion | Weight | What it means |
|---|---|---|
| The underlying numbers are published | 35 | You can see clicks and impressions separately, rather than only the ratio derived from them |
| Sample size and window are stated | 25 | You know how many brands, how many queries and over what period, so you can judge how much it means |
| It separates artefact from change | 25 | The study distinguishes a metric moving because the denominator grew from a metric moving because behaviour changed |
| Independent of the seller | 15 | The publisher does not sell the remedy the number implies you need |
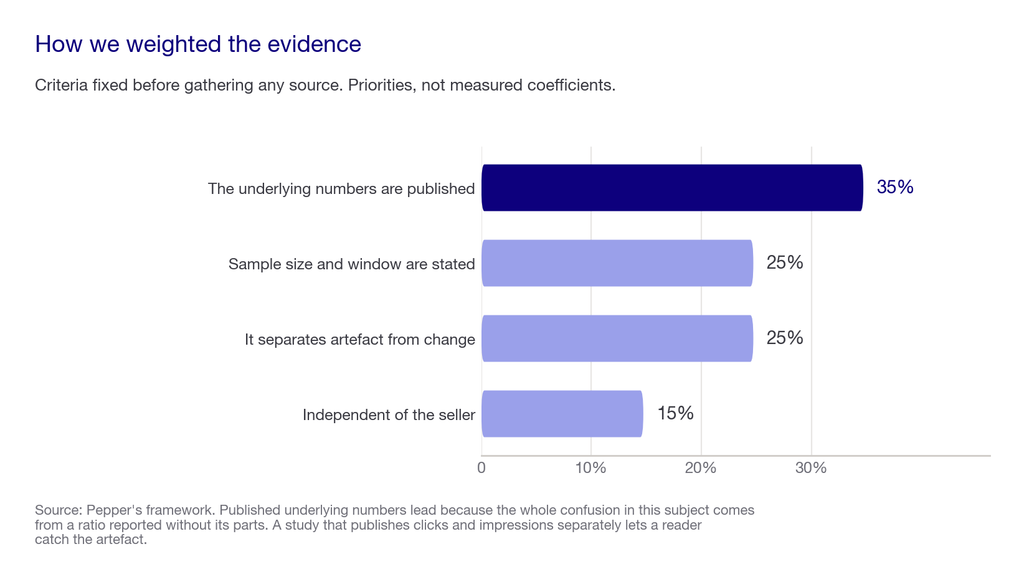
Why published underlying numbers lead. The entire confusion in this subject comes from a ratio being reported without its parts. A study that publishes clicks and impressions separately lets a reader catch the artefact. A study that publishes only the rate does not.
Where it falls short: weighting transparency highest favours studies that show their working over studies that are correct. A rigorous analysis publishing only summary figures scores badly here and may be right.
What zero-click means for your traffic, by business type
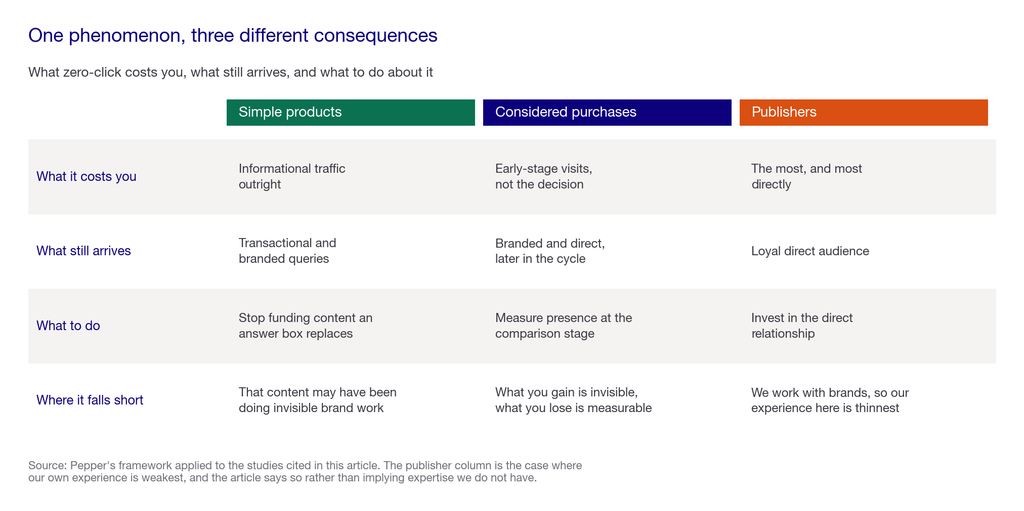
The aggregate number is close to useless for planning, because the effect differs sharply by what you sell.
Simple products and quick decisions
- What zero-click costs you. A large share of informational traffic, because the answer genuinely fits in the results page and the buyer needs nothing more.
- What still arrives. Transactional and branded queries, which are harder to satisfy in place.
- What to do. Stop funding informational content that an answer box replaces, and move the budget to the queries that still produce a visit.
- Where it falls short: the informational content may have been doing brand work you cannot see, and cutting it is easier to measure than to reverse.
Considered purchases with long cycles
- What zero-click costs you. Less than the headline suggests, because a buying committee does not decide from one answer. What you lose is early-stage visits, not the decision.
- What still arrives. Branded and direct traffic later in the cycle, which is where the influence shows up. Our work on whether GEO drives pipeline covers the attribution problem this creates.
- What to do. Move measurement upstream to presence at the comparison stage, and stop reading session counts as the health metric.
- Where it falls short: this is the hardest case to prove, because the thing you gain is invisible and the thing you lose is measurable.
Publishers and ad-funded models
- What zero-click costs you. The most, and most directly, because the visit is the product rather than a step toward it.
- What still arrives. Loyal direct audience, and the queries where the answer is genuinely too long or too opinionated to summarise.
- What to do. Treat the answer box as a distribution channel you are not paid for, and invest in the direct relationship.
- Where it falls short: we work with brands rather than publishers, and this is the case where our experience is thinnest. Take it as directionally sensible rather than expert.
Zero-click at a glance
| What you are measuring | What zero-click does to it | Is it a real change | What to do | Cost |
|---|---|---|---|---|
| Clickthrough rate | Falls, mostly because impressions inflate | Often not | Always report impressions beside it | Free. It is a chart change |
| Impressions | Rise sharply | Yes | Read as reach, not as performance | Free, from Search Console |
| Sessions | Fall in most categories | Yes, and unevenly by industry | Segment by query intent before concluding | Free |
| Branded search volume | Often rises if AI is naming you | Yes, and it is the best available proxy | Baseline it now, before you need it | Free, from Search Console |
| AI referral sessions | Tiny, under 1% of total | Yes, and it will stay small | Read as a floor, never as the measure | Free |
| Presence in AI answers | Not visible in analytics at all | Yes | Prompt tracking against a frozen set | From about $29 a month at entry tiers |
What responding to zero-click costs
- Reading your own data properly costs nothing. Putting impressions next to clicks in Search Console is a chart change, and for most teams it answers the question.
- Segmenting by query intent is analyst time, usually a day, and it is the step that tells you which decline is real.
- Prompt tracking, to measure the presence that produces no click, starts around $29 a month at published entry tiers.
- Enterprise platforms that supply the evidence base start around $2,500 a month, covered in our enterprise pricing work.
- The expensive mistake is free to avoid. Commissioning a recovery project for informational queries an answer box now satisfies permanently is the single most costly response available, and it starts with a clickthrough chart nobody decomposed.
What to measure instead
- Impressions and clicks as separate lines. If you take one thing from this article, take this. A ratio hides the only two numbers that matter.
- Branded search volume, baselined now. When an assistant names you without sending a click, this is usually where it eventually shows up.
- Presence at the comparison stage, which is the moment that decides a shortlist and produces no visit. Our guide to choosing GEO KPIs and setting targets covers how to do that.
- Sessions by query intent, not in aggregate. Informational sessions falling while commercial sessions hold is a different situation from both falling.
- Conversion rate per template, because a smaller number of better-qualified visits is a good outcome that looks like a bad one in a session chart.
How Pepper fits
Pepper is an agentic organic growth engine and an organic growth partner, and zero-click is the condition our whole practice is built around rather than a threat we are warning you about.
- Pepper’s GEO platform measures the part that produces no click. Brand Visibility for how often engines mention you, Domain Prompt Presence for how often they cite a page from your domain, and Share of Voice for your slice of the category. Those exist precisely because sessions stopped being the whole picture. See the platform.
- Agent Atlas keeps the measurement honest. Maintaining a frozen prompt set and re-running it on schedule is workflow rather than someone’s reminder. System agents stay fixed, user agents stay editable and versioned, and customers log in and build and run their own inside Atlas.
- A growth team works alongside yours on the part that is genuinely hard, which is agreeing with a board that a falling session count is not automatically bad news.
- Proof rather than adjectives. Acceldata went from 85 to more than 300 top three keywords with 6X organic traffic growth. More in our case studies, and the B2B SaaS practice.
Where Pepper falls short, and it is worth naming. We benefit commercially from the zero-click narrative, which is a reason to discount our framing rather than ours to dismiss. We also cannot measure the answers that involved no retrieval at all, and neither can anyone else.
How to choose a response to zero-click, without overreacting
I would start by refusing to act on a clickthrough chart, because most of the panic in this subject traces to one.
The framing judgement first, anchored outside my own view. Google’s guidance on optimising for generative AI features states that optimising for generative AI search is still SEO, running on core ranking systems with no separate index, and it advises against providers guaranteeing rankings because no external party has access to those systems. Read that as permission to stop treating zero-click as a separate discipline needing a separate budget. Then hold the other half, which is that Google documents Google, and the assistants answering most complex questions publish nothing comparable.
The Pepper view on top is narrower. Zero-click changed what you can measure far more than it changed what you can earn. Most of the strategy advice in this space is really measurement advice in disguise.
Here is the 100 point scorecard I would run over any partner advising you on this, including us.
| Area | Weight | What a strong partner demonstrates |
|---|---|---|
| They separate artefact from change | 30 | The first thing they do with your data is put impressions next to clicks and tell you how much of the decline is arithmetic |
| They segment by intent | 25 | Informational, commercial and branded queries are analysed separately, because zero-click hits them very differently |
| They baseline branded search | 20 | Branded and direct volume is recorded before any work starts, because that is where invisible influence lands |
| They will say your decline is normal | 15 | If your numbers match the category, they say so rather than selling you a remedy |
| They price for presence, not sessions | 10 | The plan targets appearing in answers rather than recovering a session count that is not coming back |
Then run the live test, on us as readily as on anyone else. Give any partner 25 buying questions from your own category plus a year of Search Console data, and ask them to tell you how much of your clickthrough decline is a denominator effect. Hold the answer for 90 days before acting, because engines drift and a single reading proves nothing. Ask them things a deck cannot answer. For example: “how much of our CTR fall is impressions”, “which intents actually lost sessions”, “what has our branded volume done”, “what would you not bother fixing”.
Ask them to come back with five things. The split between artefact and real decline. The intents that genuinely lost traffic. The branded search trend. What they would not try to recover. And what they would measure instead of sessions.
A partner who tells you part of your decline is not real has just cost themselves a remediation project. That is the one worth hiring.
The weaker way to respond, and it is the common one. See clickthrough fall. Read a statistic about AI Overviews. Commission a recovery project. Produce more content aimed at the queries the answer box already satisfies. Watch clickthrough keep falling, because impressions keep rising.
The stronger sequence. Put impressions next to clicks. Work out how much of the fall is arithmetic. Segment what remains by intent. Baseline branded search. Then decide what is worth recovering and what is genuinely gone. The distinction matters because the first sequence spends money reversing a ratio and the second spends it on demand that still exists.
Red flags, each one something an adviser actually says.
- A clickthrough statistic with no impression figure beside it. That is the entire error, in one number.
- “AI Overviews cut CTR by 60%” presented without the clicks-versus-impressions context from the same study.
- A recovery plan targeting informational queries that an answer box now satisfies permanently.
- No intent segmentation, which averages three very different situations into one misleading number.
- AI referral traffic presented as the replacement channel. It is under 1% of total and will stay small.
- No branded search baseline, which means invisible influence can never be demonstrated.
- A guarantee of traffic recovery, which Google itself advises against in the equivalent case.
Five questions worth asking, and what a good answer sounds like.
- “How much of our clickthrough decline is the denominator?” A good answer computes it from your own data. A bad answer quotes an industry figure.
- “Which query intents actually lost sessions?” A good answer segments. A bad answer reports a site total.
- “What has our branded search done?” A good answer has already looked. A bad answer has not considered it.
- “What would you not try to recover?” A good answer names something specific. A bad answer proposes recovering everything.
- “What should replace sessions in our reporting?” A good answer names presence metrics. A bad answer defends the session count.
If I reduce this to one principle: never act on a ratio without seeing its parts. Almost every bad decision in this subject starts with a clickthrough chart nobody decomposed.
The honest note that costs us something. Very few advisers are strong at measurement discipline, content execution, technical work and earned media at once, and we would not claim uniform strength across all four either. On this topic specifically, the incentive runs against honesty for everyone selling a remedy, us included.
What nobody should promise you
Nobody should quote a clickthrough decline without the impression figure beside it. The most-cited statistic in this subject comes from a study whose own numbers show clicks essentially flat.
Nobody should promise to recover traffic lost to zero-click. Where the answer genuinely satisfies the query, the visit is not coming back, and a plan to recover it is a plan to spend money on demand that no longer exists in that form.
Nobody should present AI referral traffic as the replacement channel. It is under 1% of total in the studies we trust, and it will stay small by design.
Nobody should promise a ranking or a citation for a fee. Google advises against providers who guarantee rankings, because no external party has access to the ranking systems.
Where this stops working, including for us
If you are a publisher or ad-funded, the visit is your product and the framing in this article is less comforting. Our experience is with brands, and we have said so above rather than pretending otherwise.
If your traffic decline is concentrated in commercial and branded queries rather than informational ones, you do not need a zero-click response at all and should not buy one. Look at competitive and technical causes first.
If you cannot segment by query intent, you cannot tell which kind of decline you have, and any conclusion from a site-total chart is a guess.
Where Pepper falls short. We benefit from this narrative, so discount our framing accordingly. And the presence metrics we sell measure influence rather than revenue, which is a genuine limitation rather than a feature.
Where to go next
Open Search Console and put impressions and clicks on the same chart for the last eighteen months. For most teams that single view answers the question this article is about.
Then segment what remains by intent before deciding anything. For the adjacent decisions, our piece on why a citation is not the same as a click covers that reframe, the visibility strategy that still works covers what to do about falling clicks, the compounding organic growth engine covers the structural response, and which KPIs to use for GEO covers what to report instead. To see where you appear when nobody clicks, see where you show up.
Frequently asked questions
What is zero-click search?
A search where the person gets their answer without visiting a website, either on the results page itself or inside an AI assistant. Featured snippets did this first, and AI Overviews and assistants now do it at far greater scale and for more complex questions.
Did AI Overviews really cut clickthrough by 60%?
Not in the way it is usually reported. The underlying study shows clicks essentially flat at 398,000 to 400,000 while impressions more than doubled from 15.8 million to 33.1 million. The rate fell because the denominator grew.
Is zero-click search killing organic traffic?
Traffic is down in aggregate, by 20.3% year on year in one 2026 study of 74 sites, but the spread runs from 39.3% in finance to 8.0% in retail. The outcome depends heavily on category and query intent.
Where do the lost clicks go?
Nowhere measurable. In the same study AI referral traffic tripled and still sits under 1% of total, and a peer-reviewed study of 973 e-commerce sites puts AI referrals under 0.2% of visits. The demand is satisfied without a visit.
How should I report clickthrough rate in 2026?
Never on its own. Put impressions on the same chart, because impressions have been inflating faster than clicks, which means your rate can fall through a quarter where nothing about your performance changed.
What should replace sessions as the headline metric?
Presence at the comparison stage, branded search volume and conversion rate per template. Sessions remain useful, segmented by query intent, but they no longer describe how much influence you have.
Does zero-click affect every business the same way?
No. Simple products lose informational traffic outright, considered purchases lose early-stage visits but not the decision, and publishers lose the most because the visit is the product rather than a step toward it.
Can you recover traffic lost to zero-click?
Where the answer box genuinely satisfies the query, no, and a plan to recover it is a plan to spend on demand that no longer exists in that form. The realistic response is to be present in the answer instead.
Sources and further reading
- Seer Interactive, the impact of AI Overviews on Google clickthrough, 2026 update, published 24 April 2026. Method: 53 brands, 5.47 million queries, 2.43 billion organic impressions and 296.9 million paid impressions, January 2025 to February 2026. Source of the clicks-versus-impressions figures (398,000 to 400,000 clicks against 15.8 million to 33.1 million impressions), the recovery in AI Overview clickthrough from 1.31% to 2.36%, and the stability of paid clickthrough between 13.99% and 17.95%. Limitations: 53 brands weighted toward companies buying enterprise search tooling, and the clicks-versus-impressions comparison covers one month rather than the whole dataset.
- e-dialog, organic traffic study of the DACH region, published 3 August 2026. Method: 74 websites across twelve industries in Austria, Germany, Switzerland and internationally, quarterly data from Q1 2024 to Q2 2026. Source of the 20.3% year-on-year decline, the industry spread from 39.3% in finance and insurance to 8.0% in retail, and the finding that AI referral traffic tripled while remaining under 1% of total. Limitations: a regional sample weighted to German-speaking Europe.
- Maximilian Kaiser and Christian Schulze, “Frontiers: ChatGPT Referrals to E-Commerce Websites”, Marketing Science, 2026. 973 e-commerce websites, $20 billion combined revenue. Source of the finding that AI referrals account for under 0.2% of all visits. Limitations: e-commerce only.
- Pepper, our comparison of zero-click and AI citation. The reframe around citations rather than clicks, and the complement to this page.
- Pepper, how to build a compounding organic growth engine. The structural response to a channel whose economics changed, and where the Seer finding is applied to the compounding question rather than the definitional one.
- Google Search Central, guide to optimizing for generative AI features, page last updated 10 July 2026. Source of the position that optimising for generative AI search is still SEO, and of the advice against guaranteed rankings.
Latest Blogs
You can check if your brand appears in AI search in about twenty minutes, on two engines, without paying for anything. The method is simple and the result is noisier than most people admit. In one 2026 pilot, ChatGPT searched the web on only 42% of buying prompts, so on the rest there was no retrieval event at all. In another, rewording a question changed the answer more than 23% of the time. This article gives you the check, then gives you the four reasons it can lie, so you can tell a real absence from a bad sample.
A blog traffic drop has five plausible causes and AI search is the most interesting one, which is exactly why people reach for it first. It is also the only one you cannot measure directly, so it should be diagnosed last, by elimination. The first check takes ten minutes and costs nothing: put clicks and impressions on the same chart. In one 2026 study of 53 brands, clicks held flat at around 400,000 while impressions more than doubled, so clickthrough halved without a single visitor being lost. Work through the other four before you conclude anything about AI.
Google publishes one eligibility rule for AI Mode, and in May 2026 it published what AI Mode users actually do. Both matter more than the fan-out arithmetic the category quotes.
Get your hands on the latest news!