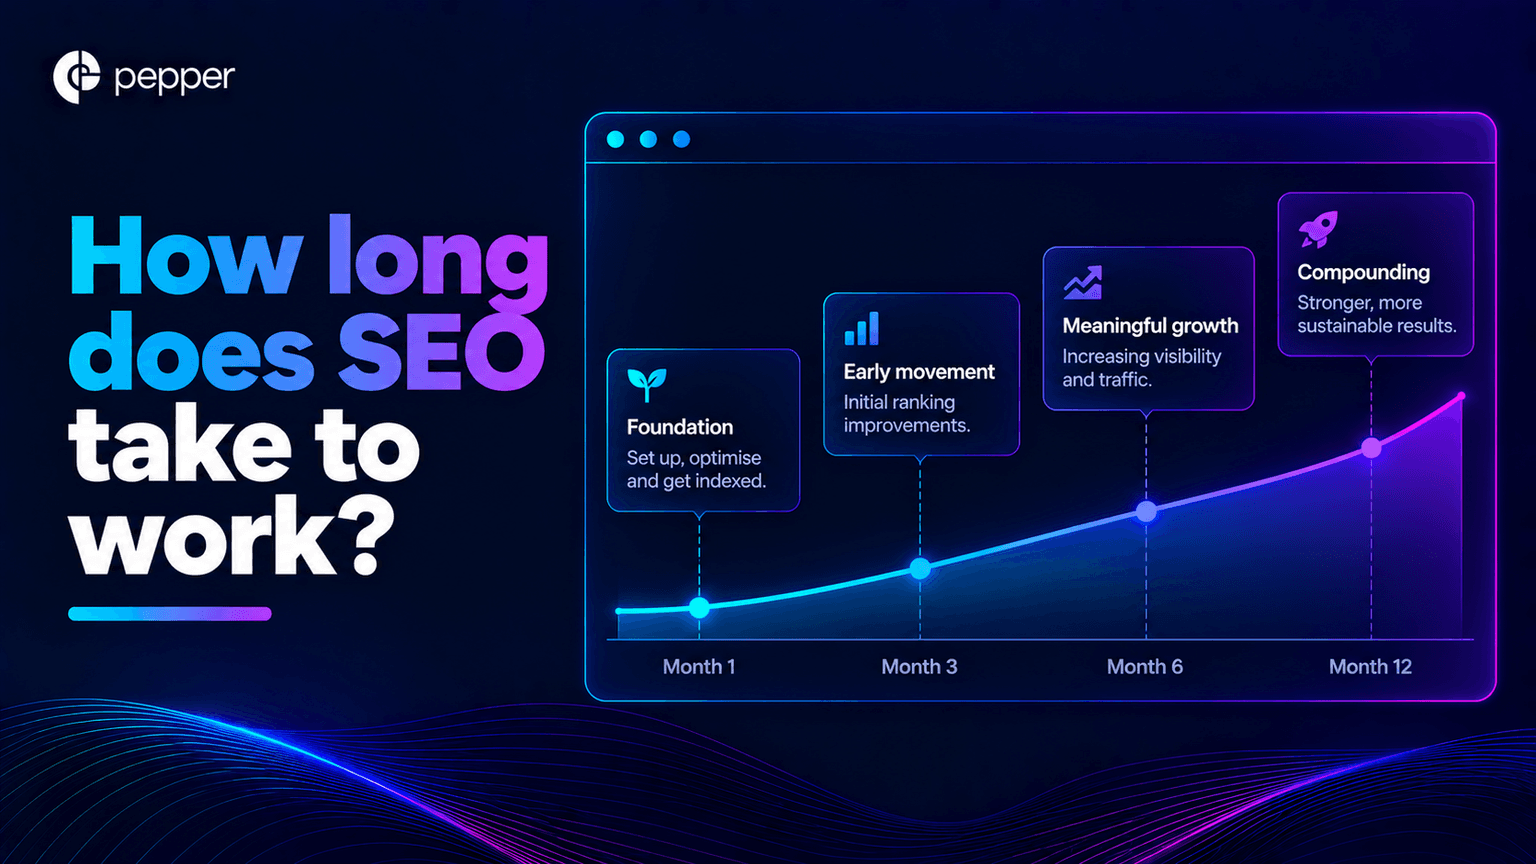
The short answer
It depends on which of three questions you are asking, and they get answered as though they were one. Technical retrieval fixes land in days to weeks. An individual page starts earning in months. A programme that genuinely compounds takes about two and a half years at a typical decay rate. Most published answers describe the second and call it the third. The number that sets your own timeline is your decay rate, which is the fraction of your working library that stops earning each quarter, and it takes an afternoon to measure.
Key takeaways
- Three timelines, not one. Technical fixes in weeks, pages in months, compounding in years. Conflating them is why published answers range from six weeks to three years.
- The fastest work is also the highest yield. Across 2,100 questions and six chatbots, more than 70% of all errors came from retrieval rather than reasoning. Fixing what an engine can fetch pays back almost immediately.
- Compounding takes about ten quarters. At a 10% quarterly decay rate a programme reaches roughly 63% of its eventual ceiling in ten quarters, which is two and a half years. Month four is when the first pages work, not when compounding starts.
- Your decay rate sets your timeline. Library ceiling is pages published per quarter divided by quarterly decay. Two teams with identical budgets can end up twice as far apart on it.
- The baseline is moving under you. Organic traffic fell 20.3% year on year across 74 sites in 2026, with a spread from 39.3% in finance to 8.0% in retail. Holding flat in a falling category is a result, not a failure.
- Clickthrough will fall even when nothing is wrong. In one analysis, clicks held at 398,000 to 400,000 while impressions more than doubled from 15.8 million to 33.1 million. Judge a programme on that and you will kill a working one.
- There are leading indicators you can read inside two quarters, and they are better than waiting for the verdict.
- Pepper is an agentic organic growth engine and an organic growth partner. Agent Atlas puts the agents in your team’s hands. Pepper’s GEO platform reports Brand Visibility, Domain Prompt Presence and Share of Voice across six engines, including ChatGPT, Perplexity, Gemini and Google AI Overviews. A growth team works alongside yours. Eight years, more than 250 enterprises, more than 10 million tracked prompts.
A note on where this comes from. I spend most of my time on what happens inside teams once a programme starts, and this question is almost always asked for a reason other than curiosity. Somebody has to defend a budget at a review. Pepper runs organic growth for more than 250 enterprises over eight years and tracks more than 10 million prompts across every major engine. The teams that survive their first year are the ones that agreed in advance which of the three timelines they were being judged against.
Disclosure: Pepper sells organic growth, so a long timeline suits us commercially: it buys patience and a longer retainer. This article says the fastest and highest-yield work is technical, that you can often do it yourself, and that for some horizons you should not start at all. Every figure traces to a named source with its method. We name competitors but never link them.
What is behind the question, how long does SEO take?
The question hides three different outcomes, and the disagreement in published answers is almost entirely about which one is being described.
- Retrieval working. An engine can fetch, parse and index your pages. This is binary and fast.
- A page working. One page earns meaningful traffic for a query you care about. This is per page and takes months.
- A programme compounding. Your working library grows faster than it decays, so each quarter’s investment adds to a stock rather than replacing it. This is the one people mean by “SEO working” and the one that takes years.
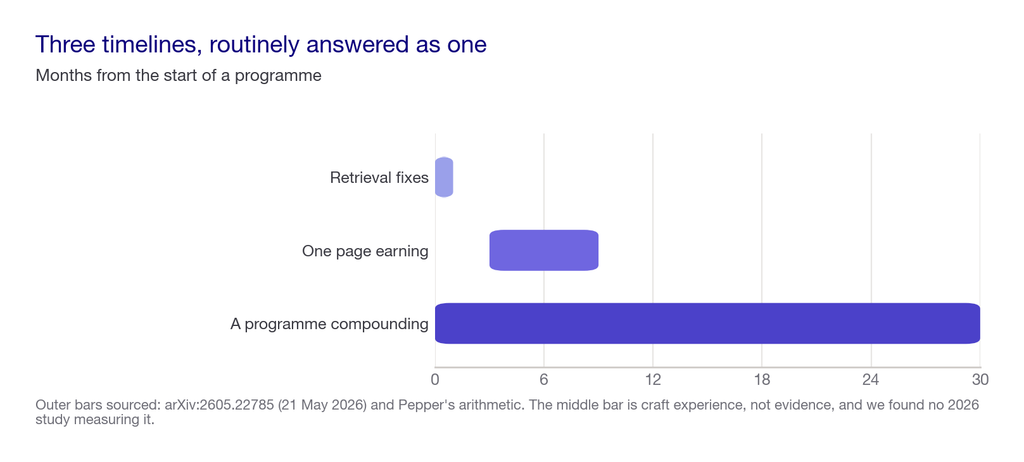
So the useful version of the question is: which of these three is my board actually asking about? In my experience it is usually the third, measured by the second, on the timeline of the first.
Two terms make the rest readable.
- Decay rate (d). The fraction of your working library that stops earning meaningful traffic each quarter.
- Library ceiling. The size your library converges on, which is pages published per quarter divided by d.
Timeline one: retrieval, in days to weeks
This is the fastest work and the most underrated, and there is now a number for why.
A study published 21 May 2026 evaluated six chatbots over fourteen days against 2,100 factual questions. It found that retrieval, not reasoning, drove more than 70% of all errors. The authors are direct about the implication. When a model lands on the correct source it usually extracts the correct answer, and the hard part is landing on it.
So the work is unglamorous and quick.
- Indexation by template. Count how many of each page type are actually indexed, not how many exist.
- Crawler access. Check robots.txt against the crawlers that matter, and note that blocking a scheduled indexer fails differently from blocking an on-demand fetcher.
- Rendering. Confirm your revenue pages produce their content without JavaScript.
There is no separate AI index to get into. Google’s guidance states its AI features run on core ranking systems, so this is the same crawl and index you already have. Our technical guide to AI crawlers works through the robots.txt consequences.
Expect results in days to weeks, because you are removing a blocker rather than building an asset.
If you would rather have someone run this first pass with you, book a growth audit and bring your template list.
Timeline two: individual pages, in months
A single page earning meaningful traffic for a query you care about takes months rather than weeks.
I am going to be honest about the evidence here, because the rest of this article is sourced and this part is not. There is no 2026 study we can point to that measures time to first meaningful traffic across a credible sample. The figures that circulate, usually three to six months, come from agency blogs quoting agency blogs. Treat our months as craft experience and nothing stronger.
What we can say with more confidence is why the range is so wide. It depends on your domain’s existing authority, how contested the query is, and whether the page answers something nobody has answered well. It also depends on whether the engine can retrieve it at all, which is timeline one.
This is also the timeline agencies quote, and there is a reason. It is long enough to bank a retainer and short enough to sell. Be alert to a proposal that quotes this timeline while promising the outcomes of timeline three.
Timeline three: compounding, in about ten quarters
This is what people mean when they ask whether SEO works, and it is the one with arithmetic behind it.
Your library follows a simple recurrence. Next quarter’s library is this quarter’s, minus decay, plus new work.
L(next) = L(now) x (1 – d) + P
Run it forward and it converges on L* = P / d. A programme reaches roughly 63% of that ceiling in ten quarters at a 10% quarterly decay rate. Two and a half years.
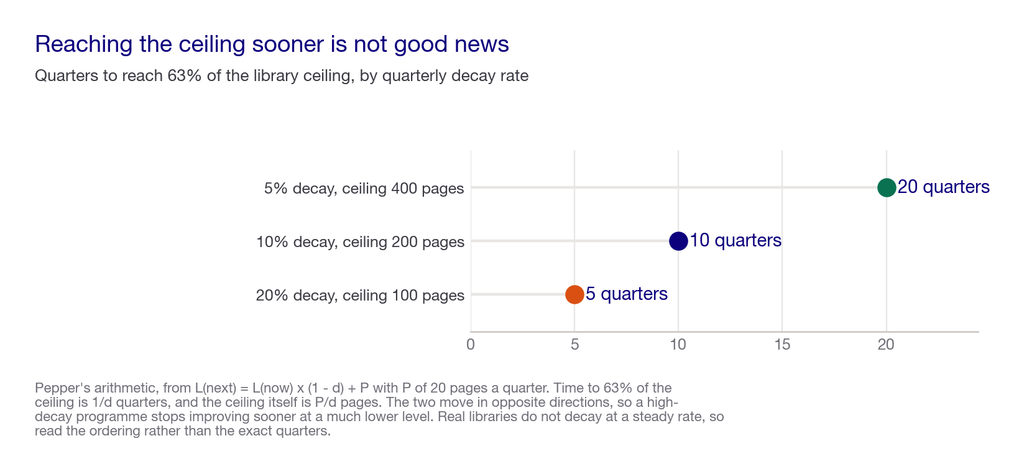
Take a team publishing 20 pages a quarter.
| Quarterly decay | Library ceiling | Quarters to 63% of it | In years |
|---|---|---|---|
| 5% | 400 pages | 20 | 5.0 |
| 10% | 200 pages | 10 | 2.5 |
| 20% | 100 pages | 5 | 1.2 |
Read that table carefully, because it contains a trap. High decay reaches its ceiling faster, which looks like good news and is not. It reaches a much lower ceiling sooner. The 20% team is flat after fifteen months at a hundred working pages. The 5% team is still climbing after five years, on its way to four hundred.
So “how long does SEO take” has two answers depending on which you want: how long until it stops improving, or how high it gets. Those move in opposite directions.
What makes it take longer in 2026
Two things have changed, and both affect how you read progress rather than how fast it arrives.
Your clickthrough will fall even when nothing is wrong. An analysis of 53 brands and 5.47 million queries, published 24 April 2026, found clicks essentially flat at 398,000 to 400,000 in the sharpest month. Impressions more than doubled over the same period, from 15.8 million to 33.1 million. Clickthrough is clicks over impressions, so the rate halved without a single visitor being lost. Report clickthrough as your headline metric and you will report a decline you did not cause.
The baseline is falling in most categories. Across 74 websites in 2026, organic traffic was down 20.3% year on year, with a spread from 39.3% in finance and insurance to 8.0% in retail.
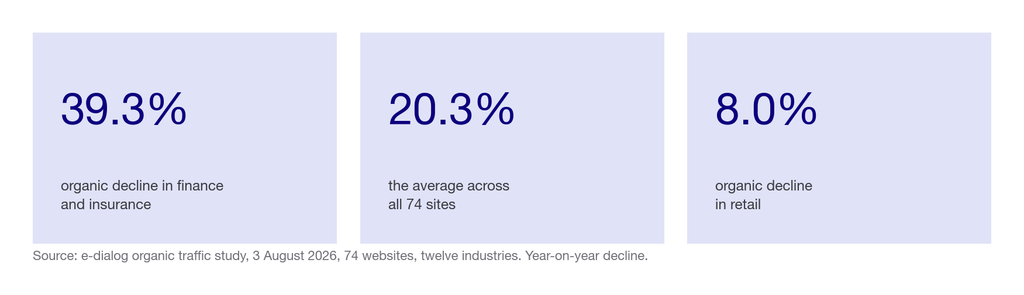
Put those together and the practical consequence is uncomfortable. A programme holding traffic flat in a category down 30% is outperforming. Measured the obvious way, it looks like it is not working. Our five-cause traffic diagnosis works through separating this properly.
How we weighted what sets the timeline
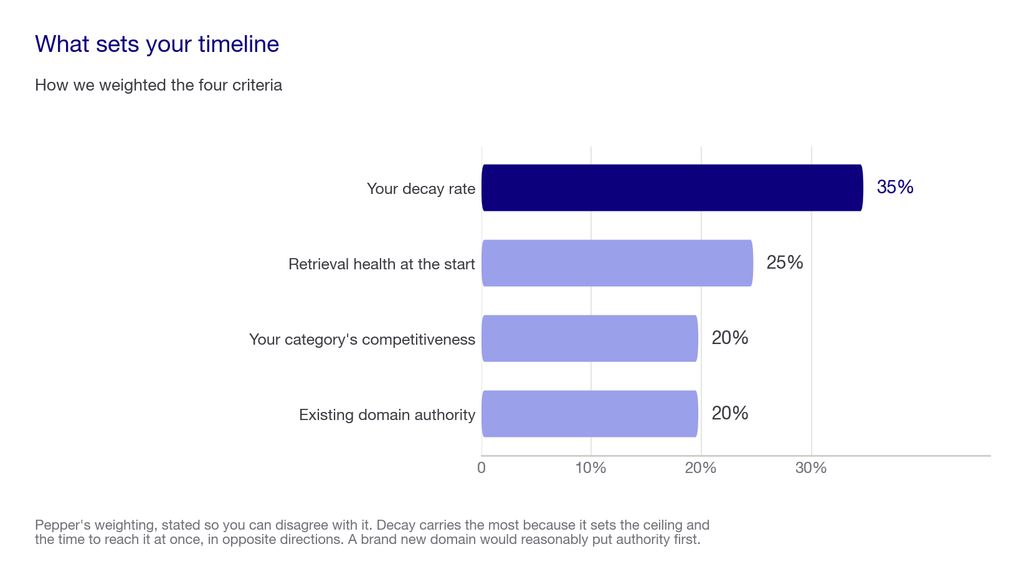
Four things move it, and not equally.
| Criterion | Weight | Why it carries that weight |
|---|---|---|
| Your decay rate | 35% | It sets the ceiling and the time to reach it at once, in opposite directions. |
| Retrieval health at the start | 25% | If templates are unindexed, nothing downstream has started yet, whatever the content calendar says. |
| Your category’s competitiveness | 20% | A contested head term and an unanswered question are different jobs on different clocks. |
| Existing domain authority | 20% | A site with history starts partway along timeline two. A new domain does not. |
The three timelines at a glance
| Retrieval | A page | A programme | |
|---|---|---|---|
| Typical time | Days to weeks | Months | About ten quarters |
| What it is measured by | Indexation and crawl coverage | Traffic to one page | Growth of the working library |
| Evidence behind the number | 70% of errors are retrieval | Craft experience, unsourced | Arithmetic, shown in full |
| Who can do it | Your developer | Your writers | A sustained programme |
| Cost | Free to low, technical time | Per page, $200 to $300 published | The whole content budget, for years |
| Fails when | Crawlers blocked, JS-dependent pages | The query is already answered well | Decay exceeds roughly 20% a quarter |
| What it looks like working | Indexed page count rises | One page earns traffic | New pages add to the stock rather than replacing it |
How to tell it is working before the long run is up
Do not wait two years for a verdict. Within one or two quarters you should see the following, and if you do not, something is wrong that more time will not fix.
- Indexation and crawl coverage improving. The fastest signal, and the one that confirms timeline one is done.
- Impressions rising ahead of clicks. Counterintuitive but correct: you are appearing in more places before you are chosen in them.
- The set of pages earning traffic growing, not churning. This is the real leading indicator. If new pages are only replacing decayed ones, you are on a treadmill and no amount of time will fix it.
- Your decay rate falling, measured the same way each quarter so the comparison holds.
- Movement in your own category’s terms, not against an industry average that describes nobody.
What this costs
Measuring your timeline costs nothing. Count the pages that earned meaningful traffic four quarters ago, count how many still do, and subtract that fraction from one. An afternoon.
Shortening the timeline costs differently by lever. Retrieval fixes are the cheapest and fastest. Cutting decay is next, and it has the same effect on your ceiling as doubling output while working on pages you have already paid for. Doubling output is the most expensive lever and the slowest to show, because it raises the ceiling without changing how fast you approach it.
How Pepper fits
Pepper is an agentic organic growth engine and an organic growth partner, which means three things working together rather than one product.
Pepper’s GEO platform is the self-serve workspace. Brand profile, competitors, personas, GA4 and Search Console connected, themes and prompts defined, with Brand Visibility, Domain Prompt Presence and Share of Voice across six engines, including ChatGPT, Perplexity, Gemini and Google AI Overviews. For this question the connected Search Console data is the useful part, because the leading indicators above are read there.
Agent Atlas is where your team builds, versions and runs its own agents, with quick runs for one input and sheet runs for bulk. Quarterly cohort analysis across a few hundred pages is exactly the repetitive work it exists for, and it is how a one-off decay measurement becomes a tracked number.
The growth team is attached to the account and works alongside yours. On this question their job is usually to hold the line on timeline three while the organisation asks about timeline two.
Where it falls short: we cannot shorten timeline three much, and nobody can. The arithmetic is the arithmetic. We can improve your decay rate and your retrieval health, which changes the ceiling and the starting point. A programme that compounds still takes years to compound. Our platform also measures AI presence rather than time to traffic, so the timeline work here happens in Search Console, not in our product.
Eight years, more than 250 enterprises, more than 10 million tracked prompts. You can see the shape of the work in the Acceldata case study, in how we run it for B2B SaaS brands, and across the case study library.
How to choose a realistic timeline
The decision is what to promise internally, and getting it wrong kills more programmes than bad execution does. So here are the criteria, weighted.
The weighted scorecard
Score each row from 1 to 5, multiply by the weight, and total out of 100.
| Criterion | Weight | Score 1 means | Score 5 means |
|---|---|---|---|
| Your measured quarterly decay rate | 35 | Above 20%, the ceiling is low and near | Under 5%, it climbs for years |
| Retrieval health today | 25 | Templates unindexed, crawlers blocked | Clean index, server-rendered |
| Patience you genuinely have | 20 | One review cycle | Three years and a sponsor |
| Existing domain history | 20 | New domain, no authority | Established, already ranking somewhere |
Under 40, promise timeline one only and do not commit to traffic outcomes. From 40 to 70, promise timeline two with timeline three as a direction of travel. Above 70, you can commit to a compounding programme, and you should hold the organisation to the longer clock.
The weaker playbook against the stronger one
The weaker approach is to promise six months because that is what gets signed off. Then you spend month seven explaining. It survives one review cycle and rarely two. The stronger approach is to agree in advance which timeline each metric belongs to. Report timeline one in month one, timeline two from month four, and timeline three annually against the ceiling rather than last year’s traffic. One manages expectations. The other sets them.
Run a live test before you commit to a date
Before promising anything, take 20 pages that earned meaningful traffic a year ago and check how many still do. Then take 20 prompts your buyers actually use and check whether you appear at all today. Good examples look like “best expense management tool for a mid-size company”, “how do I reduce support ticket volume”, or “alternatives to the incumbent for a regulated business”. Re-run both at 30 days and again at 90 days. If your decayed-page count is rising faster than your library, no timeline you promise will hold.
Red flags
- A timeline quoted without asking what your decay rate is
- Any promise of compounding results inside two quarters
- A plan with no refresh line, which assumes pages never decay
- Progress reported as clickthrough rate without impressions alongside
- A forecast built on a flat baseline in a year the category fell 20.3%
- Guaranteed rankings by a date, which Google’s own guidance advises against
- An agency that quotes timeline two and promises timeline three outcomes
Five questions worth asking any agency
- Which of the three timelines is the date in this proposal describing?
- What decay rate are you assuming, and did you measure mine or use a default?
- What will you show me in month two, before any page could reasonably rank?
- How will you report progress in a category whose baseline is falling?
- What does month twelve look like if this is not working, and what would you tell me then?
The reducing principle. It comes down to one question: is your library growing or churning? If each quarter’s new pages add to the stock, you are on timeline three and the clock is long but it ends somewhere good. If they only replace what decayed, you are not on a timeline at all, and waiting longer changes nothing. Everything else here is a refinement of that one measurement.
The honest closing note. If you have one review cycle and a new domain, you do not need us, and a content programme is the wrong instrument. Buy the traffic while you build, and start organic when you have a sponsor who can wait out ten quarters. We would rather say that than sell a three-year programme to a team that will be asked for results in six months.
What nobody should promise you
- A date for rankings. Google’s own guidance advises against providers who guarantee them.
- Compounding in six months. At 10% quarterly decay a programme is roughly ten quarters from 63% of its ceiling.
- A single industry timeline. Decay rates differ enough between teams to double or halve the answer.
- Results measured against a flat baseline. Organic fell 20.3% year on year across 74 sites.
- That more content shortens the clock. It raises the ceiling. It does not speed up the approach.
Where this stops working, including for us
Timeline two is the weak link and we have said so in the article. No 2026 study we could find measures time to first meaningful traffic across a credible sample, so that part is experience rather than evidence. If you see a confident three-to-six-month figure quoted, ask where it came from.
The decay model is deliberately simple. It assumes steady decay and steady publishing, and real libraries do neither. It is useful for the shape of the answer and for comparing decay rates. It is not a forecasting tool.
The retrieval evidence is strong but narrow. It comes from news questions over fourteen days, and news is unusually time-sensitive, so retrieval may matter more there than in a stable commercial category.
And our position is not neutral. A long timeline suits us, because it buys patience and a longer engagement. We have tried to earn the benefit of the doubt by naming the fast, cheap, technical work first and saying you can do it yourself. We also tell short-horizon teams not to start. Discount us accordingly.
Where to go next
- For the library arithmetic in full, read the compounding organic growth engine.
- If traffic is already falling, work through the five-cause diagnosis.
- For the retrieval work in timeline one, read the technical guide for marketers.
- For why clickthrough falls while clicks hold, read zero-click search.
- For how much of the discipline has actually changed, read AEO vs SEO vs GEO.
Frequently asked questions
How long does SEO take to work?
It depends which of three things you mean. Technical retrieval fixes land in days to weeks, an individual page takes months, and a programme that genuinely compounds takes about ten quarters at a typical decay rate. Most published answers describe the middle one.
Why do published answers vary so much?
Because they are answering different questions and calling them the same one. A six-week answer describes a technical fix, a six-month answer describes a single page, and a three-year answer describes a compounding programme.
What is a decay rate?
The fraction of your working library that stops earning meaningful traffic each quarter. It sets your library ceiling and the time to reach it, and you can measure it in an afternoon by comparing pages that earned traffic a year ago against those still earning now.
Does more content make SEO faster?
No. More output raises your library ceiling in a straight line, but it does not change how fast you approach it. Cutting your decay rate raises the ceiling by the same amount and works on pages you have already paid for.
How do I know it is working before results arrive?
Watch whether the set of pages earning traffic is growing or just churning. If new pages only replace decayed ones, no amount of time will fix it. Indexation improving and impressions rising ahead of clicks are the other two early signals.
My traffic is flat. Is SEO failing?
Possibly not. Organic fell 20.3% year on year across 74 sites in 2026, with declines from 39.3% in finance to 8.0% in retail. Flat in a falling category is outperformance, and judging against last year’s absolute numbers kills working programmes.
Why has my clickthrough rate dropped?
Often because impressions grew, not because clicks fell. In one 2026 analysis clicks held at around 400,000 while impressions more than doubled, so the rate halved with no visitor lost. Always report impressions alongside.
What should I fix first to shorten the timeline?
Retrieval. Indexation by template, crawler access, and whether revenue pages render without JavaScript. It is the fastest work, it costs almost nothing, and more than 70% of AI answer errors trace to retrieval rather than reasoning.
Sources and further reading
- Suzgun, Shen, Bianchi, Spangher, Icard, Ho, Jurafsky and Zou, Evaluating Commercial AI Chatbots as News Intermediaries, arXiv:2605.22785, submitted 21 May 2026. A fourteen-day evaluation of six chatbots on 2,100 factual questions from same-day BBC reporting. Source of the finding that retrieval rather than reasoning drives more than 70% of errors. Limitation: news questions are unusually time-sensitive.
- Seer Interactive AI search analysis, published 24 April 2026. 53 brands, 5.47 million queries, 2.43 billion organic impressions. Source of the flat clicks against doubling impressions.
- e-dialog organic traffic study, published 3 August 2026. 74 websites across twelve industries. Source of the 20.3% decline and the 39.3% to 8.0% category spread.
- Google Search Central, guide to optimising for generative AI features, page last updated 10 July 2026. Source of the core-ranking-systems statement and the advice against guaranteed rankings. Google describes Google Search only.
- Pepper, the library ceiling arithmetic, for the recurrence and its assumptions.
- Pepper, the five-cause traffic diagnosis, for separating decay from the other causes of a decline.
- Pepper, the crawler and robots.txt guide, for the timeline-one work in practice.
- Pepper, the three differences that survive, for how much of the discipline has actually changed.
- Pepper, why clickthrough falls while clicks hold, for the denominator effect in full.
A note on sources. Only sources published in 2026 are cited. Timeline two is deliberately unsourced, because we could find no 2026 study measuring time to first meaningful traffic across a credible sample, and we would rather say so than borrow a number from an agency blog.
Latest Blogs
Choosing a GEO agency for mid-market B2B used to be a shortlisting problem. It is now a procurement problem, because the published prices have largely gone. Of four agencies publishing a GEO-specific figure in September 2026, two had withdrawn their pricing pages by early October and one had moved domains. Exactly one still publishes a number a mid-market buyer can act on. So the useful question is no longer which agency is best in the abstract, but how to compare three quotes when only one of them arrived with a method attached.
Third-party sources and AI citations are tightly linked, and the link stops short of where most plans assume. Off-page work decides whether an engine retrieves and cites you. It does not decide whether the answer names you, and 61.7% of brand appearances are citations with no name attached. The two largest 2026 datasets also disagree about how much of the citation surface is third-party at all, one saying 84% and the other putting the brand bucket above half. That disagreement is definitional rather than factual, and it decides where a budget goes.
Why is my competitor showing up in ChatGPT and not me? Before accepting the premise, check it. Across 3,981 brand appearances studied in 2026, 61.7% were citations with no brand name in the answer and only 13.2% produced both. So there are three states that look identical from where you are sitting: genuinely absent, present as an unnamed source, and named less often than a rival. Each has a different cause and a different fix, and working on the wrong one is the most common way this gets expensive.
Get your hands on the latest news!

Similar Posts
Artificial Intelligence
11 mins read
What is anchor text, and does it still matter in 2026?
SEO
11 mins read
What is internal linking? Meaning, and what changed for AI search
SEO
15 mins read