Why your organic traffic is dropping while your rankings hold
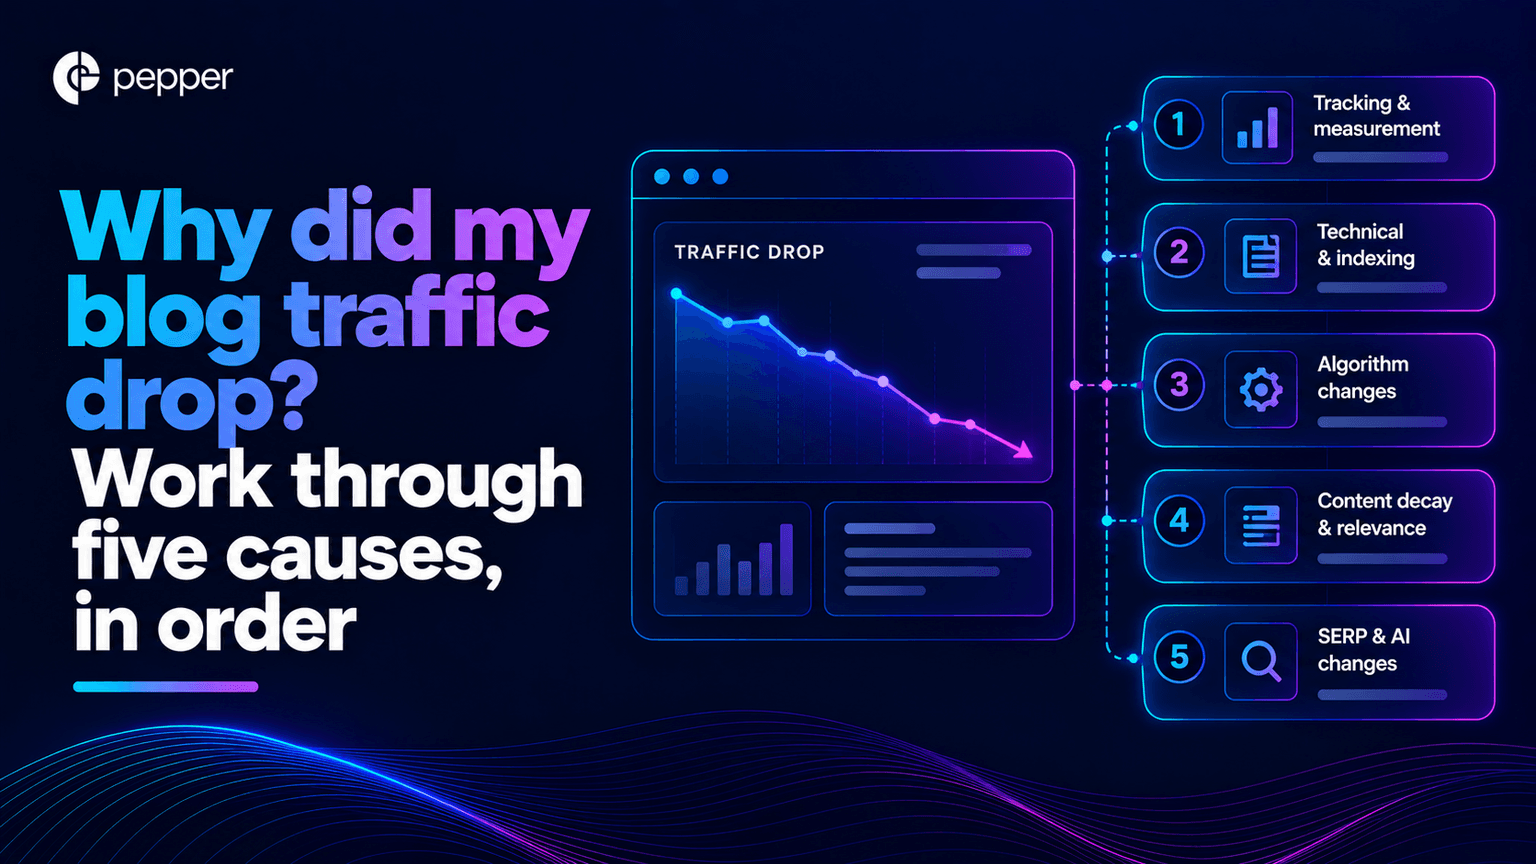
This is the single most common question we are asked in client reviews. It has six plausible answers, most teams test them in the wrong order, and Search Console is structurally unable to give you a clean one.
The short answer
Your position is a measure of where your link sits. Your traffic is a measure of whether anyone needed to click it. Those two things have been decoupling since generative features started answering the question on the results page.
Four things to understand before you start diagnosing.
- Position holding is not evidence of nothing changing. The same position on a page with an AI summary above it behaves differently from the same position without one.
- Search Console cannot isolate the loss. The generative AI performance report covers AI Overviews and AI Mode but reports impressions only, with no clicks and no queries.
- The impressions are already in your totals. That report “uses data from the Web search type in the standard Performance report”, so AI feature impressions are inside the numbers you have been reading all along.
- The best available click evidence is external. Pew Research Center found users clicked a traditional result in 8% of visits where an AI summary appeared, against 15% where none did.
The diagnostic order matters. Test whether the drop is real before you test why, because roughly a third of the drops we are shown turn out to be a measurement change rather than a traffic change.
Pepper is an agentic organic growth engine, not an SEO agency. This page comes out of what we run: organic for more than 250 enterprises across eight years, more than 10 million tracked prompts, and the questions buyers put to us in client reviews. Customers log in and run the platform themselves, with a Pepper growth team attached. Book a growth audit and we will tell you which of the six causes is actually yours.
Key takeaways
Key takeaways before you open a single report.
- Rule out measurement first. Consent banners, tag changes, filters and bot traffic produce drops that look exactly like demand loss.
- Position and clicks are different questions. Holding position three on a query that now resolves above the results is not the same business outcome it was.
- Search Console gives you impressions, not clicks, for AI features. You can see exposure in generative features, and you cannot see what it cost you.
- Query mix moves silently. A stable average position can hide a shift from high-intent to low-intent queries.
- Seasonality is real and underrated. Compare against the same period last year before diagnosing anything.
- The fix depends on the cause. Four of the six causes need content work; two need no work at all.
What is a decoupled traffic drop?
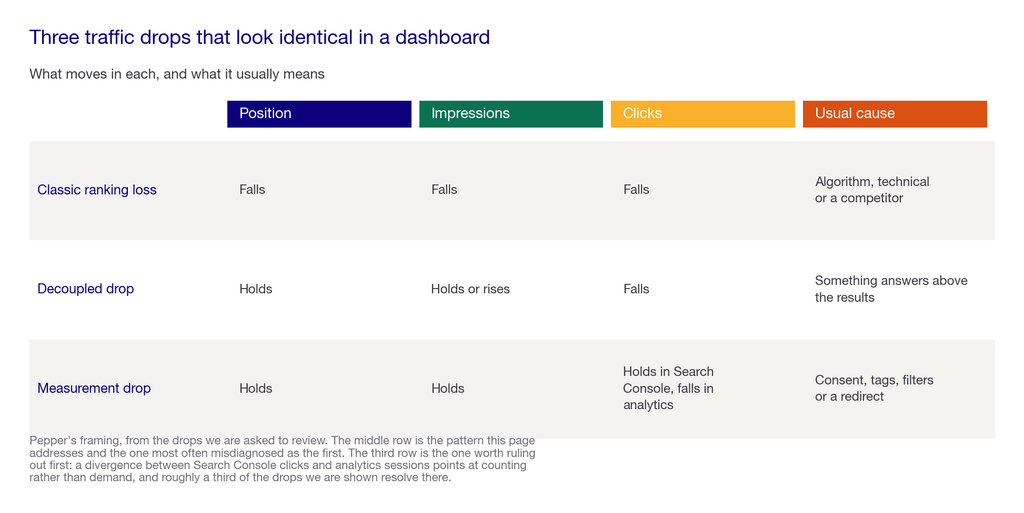
A decoupled drop is a fall in organic clicks with no corresponding fall in ranking position. It is the signature pattern of 2026, and it looks different from every other kind of traffic loss.
Three shapes are worth telling apart.
- The classic ranking loss. Positions fall, impressions fall, clicks fall together. Usually an algorithm update, a technical problem or a competitor who outranked you.
- The decoupled drop. Positions hold, impressions hold or rise, clicks fall. Something is answering the query before your link gets its chance.
- The measurement drop. Nothing moved on Google at all, and the change is in how you are counting. More common than teams expect.
Where it falls short. Real drops are frequently two of these at once, and the overlap is why single-cause explanations are usually wrong. Treat the diagnosis as elimination rather than as a search for one culprit.
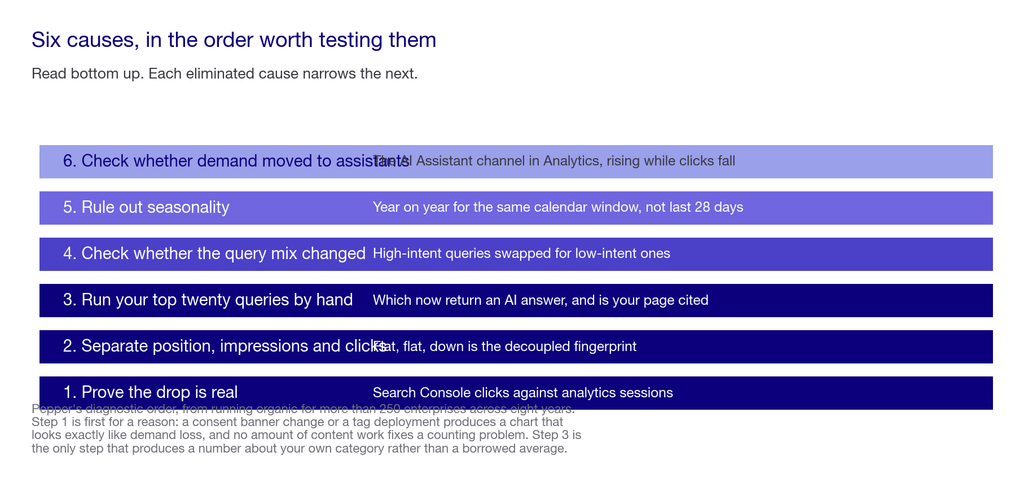
Organic traffic dropping: the six causes, in test order
Work through these in sequence. Each one is cheap to test, and each eliminated cause narrows the next.
Step 1: Prove the drop is real
Before anything else, check that traffic changed rather than measurement.
Compare Search Console clicks against your analytics sessions for the same period. Search Console counts clicks at Google’s end and your analytics counts arrivals at yours, so a divergence between them points at tracking rather than demand. Then check the obvious culprits: a consent banner change, a tag deployment, a new bot filter, a change in how internal traffic is excluded, or a redirect that quietly stopped passing a parameter.
What this proves. If Search Console clicks are flat and analytics sessions fell, you have a measurement problem and the rest of this page is irrelevant to you. If both fell together, continue.
Step 2: Separate position from impressions from clicks
Open Search Console and read the three metrics as three different questions rather than one trend line.
Position tells you where your link sat. Impressions tell you how often it was shown. Clicks tell you whether it mattered. In a decoupled drop, position is flat, impressions are flat or up, and clicks are down, which is the fingerprint you are looking for.
The structural catch. Google’s generative AI performance report covers AI Overviews and AI Mode, and reports impressions defined as “how many times links to your site were shown to a user in a generative AI feature on Google Search”. It has no clicks and no query dimension. It also “uses data from the Web search type in the standard Performance report”, which means those impressions are already inside your headline numbers. You can see that you are being shown in AI features. You cannot see what that exposure cost you in clicks, and no amount of filtering will produce that number.
Step 3: Check whether your queries now produce AI answers
This is the cause most teams assume first and test last.
Take your twenty highest-click queries from the period before the drop and run each one manually. Record whether an AI Overview or AI Mode answer appears, and whether your page is cited inside it. Twenty queries takes under an hour and gives you a real exposure rate for your own query set rather than an industry average. The same routine, applied to brand mentions, is in how to track brand mentions in AI search.
The independent evidence for what that costs is Pew Research Center’s analysis of 68,879 Google searches from 900 US adults, collected March 2025. It found that users clicked a traditional result in 8% of visits where an AI summary appeared, against 15% where no summary appeared, and that links inside the summary were clicked in 1% of visits. That is roughly half the click rate, measured on real browsing behaviour rather than modelled.
The caveat we always add. That data is from March 2025, it is Google only and US only, and Pew states the limitation itself: results “reflect how search results appeared at the time they were collected.” Use it as the shape of the effect, not as your number. We work through what it does and does not prove in are AI Overviews taking your clicks.
Step 4: Check whether your query mix changed
A stable average position can hide a complete change in which queries you rank for.
Export your queries for the drop period and the comparable period before it, then compare the top fifty by clicks rather than by position. What you are looking for is substitution: high-intent commercial queries replaced by informational ones, or branded queries replaced by generic ones. Average position stays flat because you gained as many as you lost. Revenue does not, because the ones you lost were the ones that converted.
What this proves. If the mix shifted toward lower-intent queries, your traffic problem is really a relevance problem, and the fix is content rather than technical. The planning side of that is in how to build an SEO content plan.
Step 5: Rule out seasonality and the comparison window
Compare the same period a year earlier before you conclude anything.
Most drop investigations we are asked to review compare the last 28 days against the previous 28 days, which puts a holiday, a quarter-end or an industry event on one side of the comparison and not the other. Year-on-year for the same calendar window removes that, and it is the comparison we would put in front of a board.
What this proves. If the year-on-year line is flat, you have a seasonal pattern rather than a decline, and the right action is to do nothing and say so clearly.
Step 6: Check whether demand moved to assistants
The last cause is the hardest to see, because it does not appear in Google’s reporting at all.
Analytics now carries an AI Assistant channel for traffic arriving from assistants including ChatGPT, Gemini, Copilot and Google’s AI features. It is small for most sites and it is growing. If that channel is rising while organic clicks fall, some of your demand has moved rather than disappeared, and the response is to be citable in those answers rather than to fight for the click.
What this proves. A rising assistant channel alongside falling organic clicks is the strongest available evidence that the loss is a surface shift rather than a demand drop. The full setup is in how to know if AI search is sending you traffic.
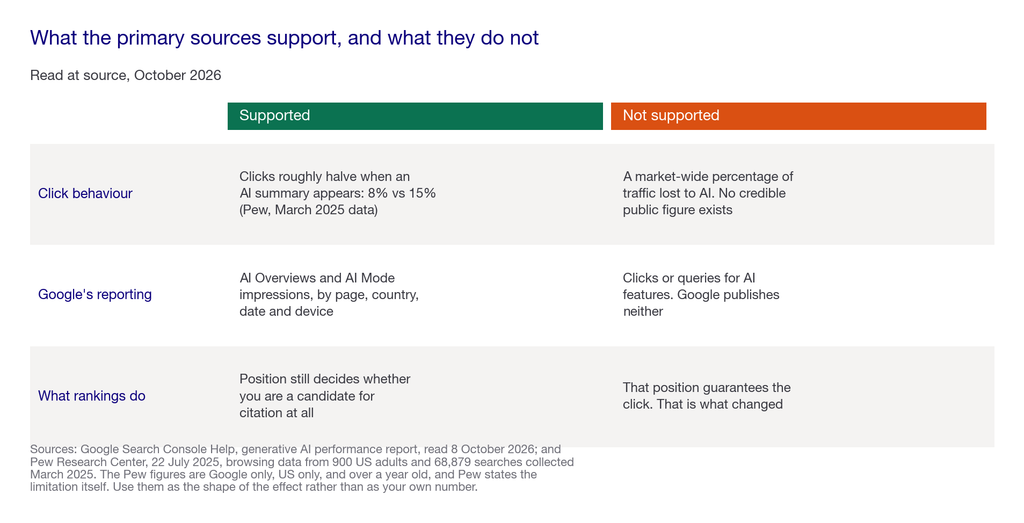
What the evidence actually supports
Three claims are well supported, and a great deal of what circulates is not.
Supported: click rates fall when an AI summary appears. Pew’s 8% against 15% is real, measured on browsing data rather than modelled, and it is the most credible public figure on this question.
Supported: Google now reports AI feature exposure. The generative AI performance report exists, covers AI Overviews and AI Mode, and gives impressions by page, country, date and device.
Supported: Google does not give you the click cost. No click metric and no query dimension in that report, by Google’s own documentation.
Not supported: a market-wide percentage of traffic lost to AI. Nobody has published a credible figure, the ones in circulation are vendor estimates or projections, and the variation between categories is large enough to make any average useless for your planning.
Not supported: that rankings no longer matter. Position still determines whether you are a candidate for citation at all, which is the argument in what is changing in SEO in 2026. What changed is that position stopped guaranteeing the click.
What to do about each cause
The action is different in each case, and two of the six need no action at all.
- Measurement problem. Fix the tracking, restate the period, and tell whoever received the alarming chart that it was wrong. This is unglamorous and it is the highest-value outcome on the list.
- Seasonality. Do nothing. Report the year-on-year comparison and move on.
- Query mix shift. Content work. Find which commercial queries you lost and why, and whether the pages that served them are still answering the question a buyer now asks.
- AI answers above you. Shift the objective from the click to the citation. If an engine is going to answer the question, the useful outcome is that it answers it using your page and names you.
- Demand moved to assistants. Measure it properly, then work on being citable in those answers. The mechanics are in how to structure content for answer engines.
- Genuine ranking loss. Treat it as a classic SEO problem, because that is what it is. Technical, content or competitive, in that order.
The uncomfortable one. For a category where the questions are now answered on the results page, some of that traffic is not coming back, and a plan built on recovering it will fail. The honest move is to change what you are optimising for. And if your category is one where buyers still click, you do not need a GEO programme this year, which we will say in the first call rather than the third.
How to report this upward
The reason this question is asked so often is that somebody senior has seen a chart and wants an explanation by Friday.
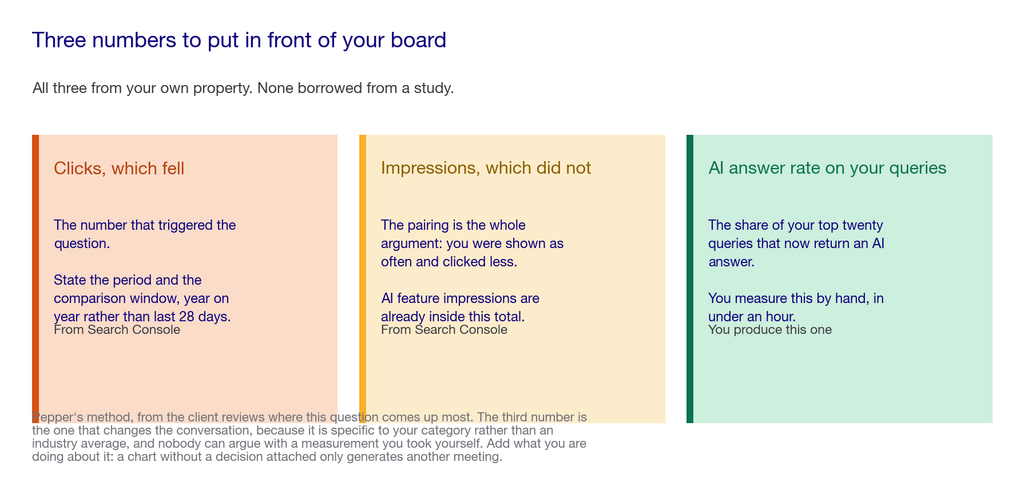
Give them three numbers rather than one narrative. Clicks, which fell. Impressions, which did not. And the share of your top queries that now return an AI answer, which you measured yourself in step three. Those three together explain the pattern without needing a market statistic, and they are all defensible because you produced them from your own property.
Then give them the one thing a chart cannot: which of the six causes it is, and what you are doing about it. We cover how to build the wider case in how to build a business case for GEO.
What nobody should promise you
- A percentage of your traffic lost to AI. No credible public figure exists, and category variation makes averages meaningless for planning.
- Recovery of clicks to a query that now resolves on the results page. Some of those clicks are structurally gone.
- A single cause. Real drops are usually two or three of the six at once, and a vendor who diagnoses yours in one meeting has guessed.
- Click data for AI Overviews. Google does not publish it. Anybody showing you a precise AI Overview click number is modelling, and should say so.
Frequently asked questions
Why is my organic traffic dropping when my rankings have not changed?
Most often because the queries you rank for now produce an AI answer above the results. Pew Research Center found click rates roughly halve when an AI summary appears, at 8% against 15%, so position can hold while clicks fall.
How do I tell whether it is AI Overviews or something else?
Run your top twenty queries manually and record which produce an AI answer. Then check Search Console’s generative AI performance report for AI feature impressions by page. Neither gives you clicks, so the manual check is the one that tells you exposure.
Reading the reports
Does Search Console show AI Overview clicks?
No. The generative AI performance report covers AI Overviews and AI Mode and reports impressions only, defined as how many times links to your site were shown in a generative AI feature. There are no clicks and no query dimension.
Are AI feature impressions counted in my normal Search Console totals?
Yes. Google’s documentation states the report uses data from the Web search type in the standard Performance report, so those impressions are already inside the numbers you have been reading.
What is the AI Assistant channel in Analytics?
A default channel grouping for traffic arriving from AI assistants, including ChatGPT, Gemini, Copilot and Google’s AI features. It is the only place most sites can see assistant-referred visits without custom configuration.
Acting on it
Should I stop doing SEO if clicks are falling?
No. Position still determines whether you are a candidate for citation at all. What changed is that ranking stopped guaranteeing the click, so the objective shifts from the visit to being the source the answer uses.
How long before I can tell whether a fix worked?
Give it a full quarter for content changes, and compare year on year rather than month on month so that seasonality does not do the talking for you. Weekly readings on this question are noise, and acting on them produces changes nobody can attribute later.
Is some of this traffic simply gone?
Yes, for queries that now resolve fully on the results page. Planning to recover those clicks wastes a quarter. Planning to be the source the answer cites does not.
Sources
Every claim here traces to a primary source, read directly. Where we could not verify something, we have said so rather than filled the gap.
Primary sources
- Google Search Console Help, Generative AI performance report (Search), read 8 October 2026. Covers AI Overviews and AI Mode. Defines impressions as “how many times links to your site were shown to a user in a generative AI feature on Google Search”, with dimensions for pages, countries, dates and devices, and states that the report uses data from the Web search type in the standard Performance report. No clicks and no query dimension.
- Pew Research Center, Google users are less likely to click on links when an AI summary appears, 22 July 2025. Browsing data from 900 US adults, 68,879 unique Google searches collected March 2025. Clicks on a traditional result in 8% of visits with an AI summary against 15% without, and 1% clicking a link inside the summary. Non-commercial research organisation. Pew states results “reflect how search results appeared at the time they were collected.”
- Google Analytics Help, Default channel group, read 8 October 2026. Defines the AI Assistant channel for traffic arriving from assistants including ChatGPT, Gemini and Copilot.
On what this page is not
This is a diagnostic procedure, not a measurement of the market. We have deliberately not given you a percentage of traffic lost to AI, because no credible public figure exists and the ones in circulation are projections or vendor estimates. Every number we have used comes from a primary source you can open yourself, and the three numbers we recommend reporting upward are ones you produce from your own property rather than ones you borrow from a study.
Latest Blogs
Most advice on this is inference dressed as fact. OpenAI documents exactly one thing clearly, which is access. Here is what is documented, what is inferred, and how to verify the rest for yourself.
Being named in an AI answer and having your page used as its source are different outcomes with different causes and different fixes. The gap between them is the most useful diagnostic in AI search, and most reporting collapses it into one number.
Every platform reports share of voice and almost none of them define it the same way. Here is the definition worth using, the three choices that change the number, and how to measure it yourself without buying anything.
Get your hands on the latest news!