The GEO measurement stack: which AI search visibility metrics actually mean anything

The short answer
A single AI visibility score is the wrong shape for this problem. It compresses four different questions into one number, and the moment it moves you cannot tell which of the four changed.
The useful AI search visibility metrics sit in a stack of four layers: does the engine name you, does it cite your domain, what share of the category do you hold, and does any of it arrive and do something. Each is measurable. None of them is interesting on its own.
The diagnosis lives in the gaps between the layers. Named often but rarely cited is a citability problem. Never named at all is an awareness problem. Cited but no arrivals is a consequence problem. Those three have completely different fixes and completely different suppliers, and a composite score hides all of it.
Key takeaways
- Four layers, not one score. Presence, citation, share and consequence. Report all four or report none of them.
- The gap between presence and citation is the most useful number you are not tracking. Engines naming you while quoting somebody else is the most common pattern we see in accounts we take over.
- A metric with no sampling method is a reading, not a measurement. Engines are probabilistic, so state the prompt set size, the runs per prompt and the cadence, or the number means nothing.
- You can finally see the consequence layer. Google Analytics 4 now assigns an AI Assistant channel, with
ai-assistantwritten to the Medium dimension, covering ChatGPT, Gemini, Copilot, Claude and Perplexity. - The classic stack does not retire. Google’s guidance says optimising for generative AI search is still SEO, so rankings, traffic and conversions stay on the dashboard next to the four layers, not instead of them.
A note on where this comes from. We run organic for more than 250 enterprises and track more than 10 million prompts across every major engine. The layer definitions are how our own platform reports, the GA4 detail is Google’s own documentation, and the judgement about which metrics deserve a dashboard line is ours, shaped by the reporting arguments we have in client reviews most weeks.
Book a growth audit if you want the four layers measured on your own category before you build the dashboard.
What are AI search visibility metrics, and why is one score not enough?
An AI search visibility metric is any measure of how an answer engine treats your brand when somebody asks a question you should win.
The temptation is to roll them into one percentage, because a single number is easy to put on a slide and easy to set a target against. We have done it ourselves, on a page still live as we publish this one. The problem is not that a composite is inaccurate. It is that it is uninformative.
Consider two brands with the same score. One is named in most answers and cited in almost none. The other is named rarely but cited every time it appears. They have opposite problems, opposite budgets and opposite suppliers, and the score cannot tell them apart. A universal benchmark makes it worse, because presence rates vary enormously by category, and “above 25%” means something different in enterprise software and in running shoes.
So we report the layers separately and treat the differences between them as the finding. If you want the underlying model of why an engine fails to use you at all, Visibility, Citability and Retrievability is the diagnostic framework this stack measures against.
The four layers
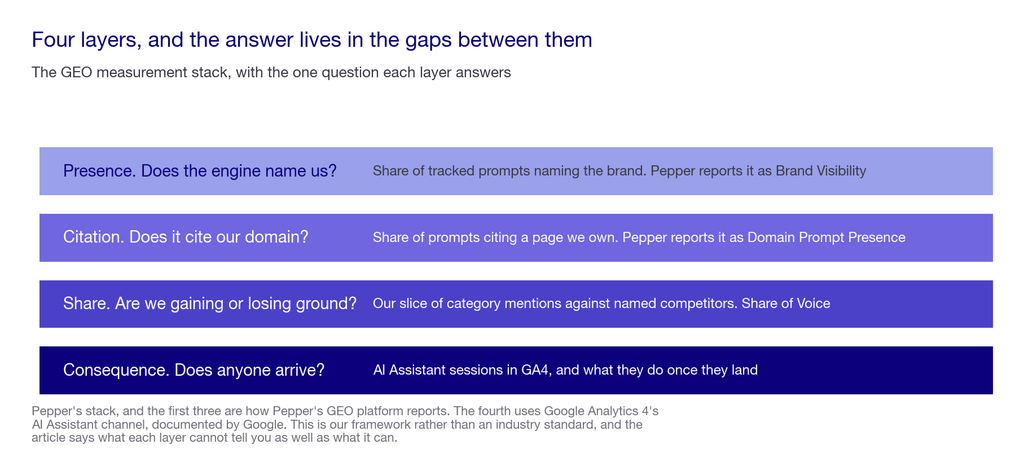
Layer 1: Presence. Does the engine name you?
Definition: the share of your tracked prompts where the engine names your brand, in any form, across the engines you care about.
Pepper reports this as Brand Visibility. It is the cheapest layer to measure and the one most dashboards stop at.
What it tells you: whether you are in the conversation. Nothing more.
What it does not tell you: whether the mention helped. A brand named as the expensive option is present and losing.
Layer 2: Citation. Does it cite your domain?
Definition: the share of tracked prompts where the engine cites a page on your own domain as a source.
Pepper reports this as Domain Prompt Presence. It is harder to move than presence and it is the layer that connects to work you actually control.
What it tells you: whether your pages are being used as evidence rather than your brand being recalled from training.
What it does not tell you: whether the cited page was the one you wanted. Track which pages get cited, at page level, and how often each one does.
Layer 3: Share. What slice of the category do you hold?
Definition: your proportion of all brand mentions across the same prompt set, against named competitors.
Pepper reports this as Share of Voice. It is the only layer that is relative, which makes it the one executives understand fastest.
What it tells you: whether you are gaining or losing ground, independent of whether the category as a whole is growing.
What it does not tell you: anything about quality. Share can rise because a competitor stopped publishing.
Layer 4: Consequence. Does anyone arrive, and do they do anything?
Definition: sessions attributed to AI assistants, and what those sessions do.
This is the layer that was unmeasurable a year ago and is now straightforward. Google Analytics 4 assigns an AI Assistant channel in the default channel group. When the referrer matches a recognised assistant, GA4 writes ai-assistant to the Medium dimension and (ai-assistant) as the campaign name. Recognised assistants include ChatGPT, Gemini, Microsoft Copilot, Claude and Perplexity.
You can extend it with a custom channel group using a regex on source, and Google’s own guidance is to order that channel above Referrals so it captures the traffic before the generic bucket does.
What it tells you: whether presence and citation convert into anything.
What it does not tell you: the full picture. Some assistants pass no referrer, so a share of this traffic lands in Direct and is unrecoverable without tagging. Treat the consequence layer as a floor, not a total.
The gaps are the diagnosis
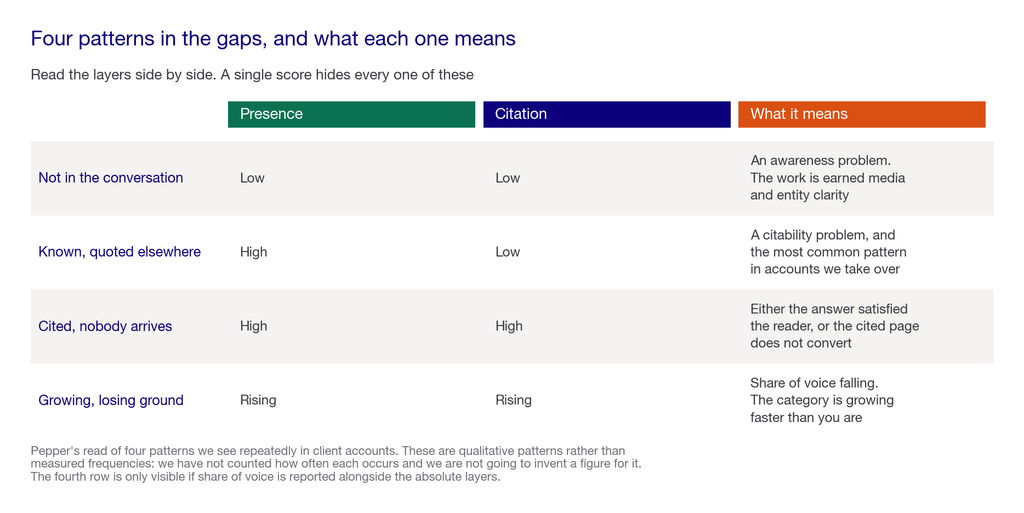
This is the part worth building a dashboard around, and it is why the layers have to be reported side by side.
- Presence low, citation low. You are not in the conversation. Nothing on your own site fixes this quickly, because engines cite third-party sources far more than brand-owned ones. The work is earned media and entity clarity.
- Presence high, citation low. The most common pattern in accounts we take over. Engines know you and quote somebody else. This is a citability problem: your pages are not being used as evidence. The work is on the pages themselves and on the sources that talk about you.
- Citation healthy, consequence flat. Either the answer satisfied the reader without a click, which is normal and not a failure, or the cited page does not convert the traffic it gets. Check which page is cited before concluding anything.
- Share falling while presence rises. You are growing and the category is growing faster. This is the reading most likely to be missed by an absolute-only dashboard, and the one executives most need to see.
Where this falls short: these are patterns we see repeatedly, not measured frequencies. We have not counted how often each occurs across our accounts and we are not going to invent a percentage for it.
What makes a number a KPI rather than a reading
Engines are probabilistic. Ask the same question three times and you can get three different answers, with different brands named. That single fact disqualifies most of what gets reported as AI visibility.
A number earns the word KPI when it carries three things:
- A prompt set. How many prompts, chosen how, and frozen. Twenty-five real commercial questions is a workable floor. A set that changes between reporting periods measures nothing.
- A sampling method. How many runs per prompt, on what cadence, across which engines. Three runs per prompt is our floor. One run is an anecdote.
- A stated engine list. Presence across four engines and presence across nine are different numbers with the same name.
This is not a theoretical concern. Our own comparison of AI search visibility tools ranked by data accuracy found that only five of fourteen platforms publish enough for you to compute their own sampling rate. If your supplier cannot tell you the three things above, you are reporting their marketing rather than your performance.
When you can actually read each layer
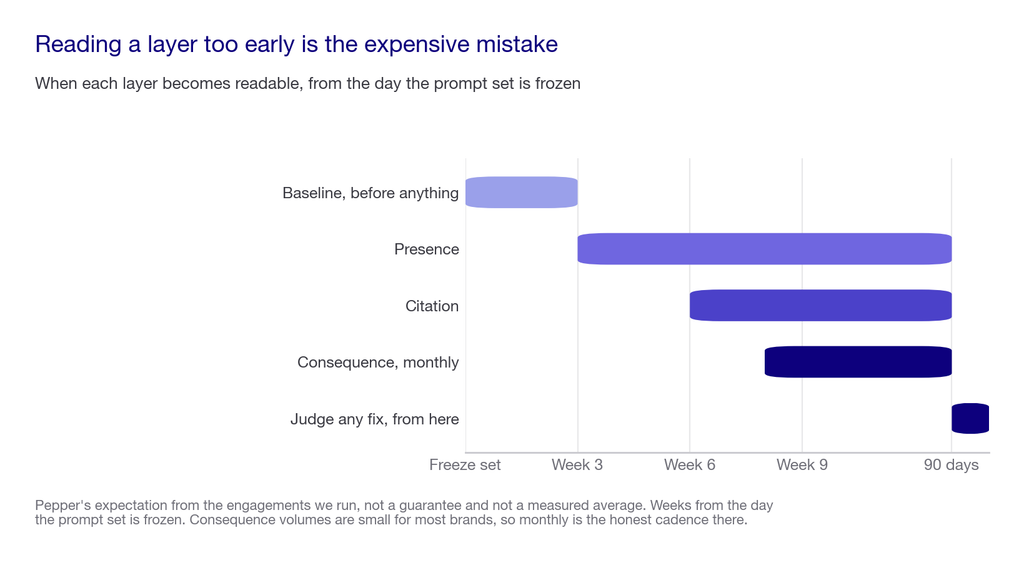
The most expensive mistake in this category is reading a number too early and acting on it.
- Baseline: two to three weeks. You cannot compare anything until the prompt set has been run repeatedly enough for the variance to show. This is not setup time, it is measurement time.
- Presence: from week three. The fastest layer to move and the fastest to read, because mentions respond to third-party coverage sooner than citations do.
- Citation: from about week six. Slower, because it depends on pages being crawled, re-evaluated and then chosen as evidence.
- Consequence: from about week eight, and it is noisy. Volumes at this layer are small for most brands, so monthly rather than weekly reading is the honest cadence.
- Anything at all: 90 days before a judgement. This is the number we would defend hardest.
Our methodology: which metrics earn a dashboard line
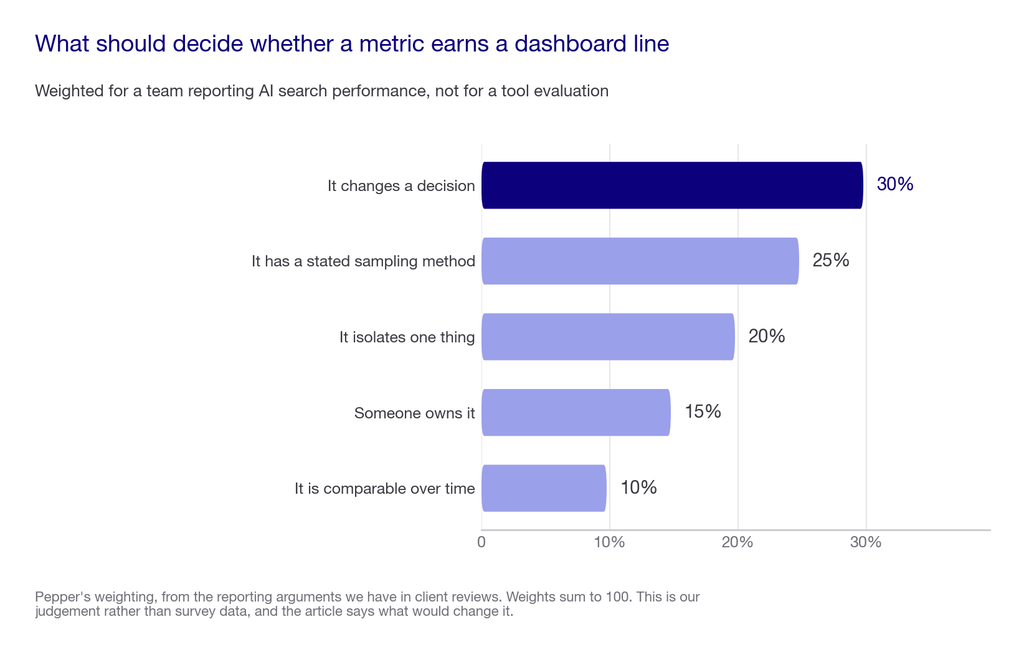
| Criterion | Weight | Why it carries that weight |
|---|---|---|
| It changes a decision | 30 | If no plausible movement in this number would change what you do next week, it belongs in an appendix rather than on a dashboard. |
| It has a stated sampling method | 25 | Prompt set, runs per prompt, engines and cadence. Without all four, the number is a reading somebody took once. |
| It isolates one thing | 20 | A metric that moves for three different reasons cannot be acted on. This is the argument against a composite score in one line. |
| Someone owns it | 15 | A number with no owner drifts. Name the person accountable for each layer, including the ones you do not control. |
| It can be compared over time | 10 | A frozen prompt set and a fixed cadence, or you are comparing this month’s question to last month’s. |
Weights sum to 100. Decision relevance and sampling carry 55 between them, which is a judgement rather than a fact, and it is the judgement this page rests on. We publish our weightings the same way we publish [how we rank GEO agencies](https://www.pepper.inc/blog/geo-agency-ranking-methodology/), so you can argue with them precisely.
What would change these weights. If you are reporting to a board rather than running a programme, comparability over time rises sharply and isolation matters less. If you have just started, sampling outranks everything, because a bad baseline poisons every subsequent read.
The GEO measurement stack at a glance
| Layer | Metric | What it answers | Cadence | Typical cost to measure | What it cannot tell you |
|---|---|---|---|---|---|
| Presence | Brand Visibility | Does the engine name us? | Weekly | Low. Free tiers cover it | Whether the mention helped |
| Citation | Domain Prompt Presence | Does it cite our pages? | Weekly | Low to medium | Whether the right page was cited |
| Share | Share of Voice | Are we gaining or losing ground? | Monthly | Medium. Needs a competitor set | Anything about quality |
| Consequence | AI Assistant sessions and what they do | Does it arrive and convert? | Monthly | Free in GA4, with setup | The full total. Some traffic lands in Direct |
| The gaps | Presence against citation | Which problem do we actually have? | Weekly | Free once the first two exist | Why, on its own. It points, it does not explain |
| Classic stack | Rankings, organic sessions, conversions | Is the underlying discipline working? | As now | Already paid for | Anything specific to answer engines |
What this costs to run
- The first two layers are cheap. Free tiers at several platforms cover a starter prompt set, and our ranked comparison of visibility tooling covers who publishes what at which price.
- Share of voice costs more, because it needs a maintained competitor set and enough runs to be stable across several brands rather than one.
- The consequence layer is free and mostly unbuilt. GA4’s AI Assistant channel needs no licence. The cost is an afternoon of configuration and the discipline to tag campaigns.
- The expensive part is none of the above. It is the time to agree definitions, freeze a prompt set and hold the cadence. Every dashboard we inherit that nobody trusts failed at that step rather than at tooling.
For what the work behind the numbers costs, our generative engine optimization cost benchmarks collects 30 published prices, and GEO ROI modelling covers turning the consequence layer into a business case.
Where Pepper fits
We are an agentic organic growth engine, and the four layers above are how we report rather than a framework we invented for an article.
- An organic growth partner. A growth team is attached to your account, a senior strategist plus always-on agents, accountable for the number moving rather than for the dashboard existing.
- Pepper’s GEO platform. Genuinely self-serve and included rather than billed as a separate licence. You log in and set up a workspace. Define your brand profile, competitors and personas, connect GA4 and Search Console, then manage your own themes, prompts and analytics across six engines including ChatGPT, Perplexity, Gemini, Claude and Google AI Overviews.
- The Agent Atlas. Your team builds, versions and runs its own agents, and keeps them.
Brand Visibility, Domain Prompt Presence and Share of Voice are the first three layers by name, and the gap between the first two is the diagnostic we care about most. For what the combination produces, the Acceldata case study records 6X organic traffic and top-three keywords rising from 85 to more than 300, mostly through B2B SaaS programmes.
Where it falls short: we publish no aggregate benchmark for what a good Brand Visibility number looks like, and we will not, because it varies too much by category to be honest. That makes us less useful than a supplier who hands you a target. We do not close the attribution loop from citation to revenue either, and nobody does. And we have a live page that contradicts this one, which is the least comfortable sentence in this article and the reason it is in the disclosure at the top.
How to choose which KPIs to report
I will write this in the first person, because a recommendation nobody will defend is worth nothing.
Start by naming the decision each number is supposed to inform. Most dashboards in this category are inventories rather than instruments: every metric the tool offers, arranged by how easy it was to export. If you cannot say what you would do differently when a number moves, it does not belong on the page.
So my order is: pick the decision, pick the layer that informs it, define the sampling, then freeze it. Here is the scorecard I would use on any proposed metric, on a 100 point scale.
| Area | Weight | What a reportable metric demonstrates |
|---|---|---|
| A named decision it informs | 30 | Somebody can say what they would do differently if it moved five points. Without that, it is an inventory item. |
| A sampling method in writing | 25 | Prompt set size, runs per prompt, engines and cadence, all recorded where the dashboard is read rather than in somebody’s head. |
| It isolates a single cause | 20 | When it moves, the reason is narrow enough to act on. Composite scores fail here by design. |
| A named owner | 15 | One person accountable for the layer, including layers you influence rather than control. |
| Comparable to last period | 10 | Same prompts, same engines, same cadence. Any change to the set resets the series and should be dated. |
Five questions I would ask before putting any metric on a dashboard, in this order.
- “What would we do differently if this moved five points?” A stronger answer names an action and an owner. A weaker one says it would be good to know, which means it belongs in an appendix.
- “How many prompts, how many runs, which engines?” If the supplier cannot answer all three, the number is not comparable to anything, including itself last month.
- “Which page got cited?” Citation counts without page-level detail hide the most useful finding on the dashboard, which is usually that the wrong page is doing the work.
- “Is this absolute or relative?” Presence can rise while share falls. Report both or you will celebrate the wrong quarter.
- “Who owns this number?” Unowned metrics survive on dashboards for years without anyone noticing they stopped updating.
Red flags, each one something a supplier actually says. “Your AI visibility score is 32”, offered with no definition of what was sampled. A universal benchmark for what good looks like, which cannot exist across categories. Weekly reporting on a consequence layer whose volumes are too small to read weekly. A prompt set the supplier changes without telling you, which silently resets your baseline. And any guarantee of citations, which nobody can promise.
Before you buy tooling, build the baseline yourself. Write 25 real commercial questions your buyers would type. Run each of those 25 prompts three times across every engine you care about, because one run is an anecdote. Then give any fix 90 days before you judge it. Four worked examples for a mid-market B2B software company:
- “best data observability platform for enterprise”
- “how do I monitor data quality across Snowflake and Databricks”
- “what should I look for in a data observability vendor”
- “who competes with Monte Carlo in data observability”
Record two numbers per prompt: were you named, and was a page from your domain cited. That is layers one and two, built by hand, and it is enough to tell you which problem you have. Checking whether your brand appears in AI search walks through it properly.
And the answer that loses Pepper the sale: if you have not run that exercise, do not buy a measurement platform and do not hire us to run one. Most teams discover in an afternoon that they have an awareness problem rather than a measurement problem, and no dashboard fixes that.
It comes down to one principle: report the layers, and act on the gaps. A single score is easier to present and impossible to act on, ours included on the page this one contradicts.
What nobody should promise you
- A single composite AI visibility score. It compresses away the diagnosis, which is the only part worth having. We have promised this ourselves and we were wrong to.
- A universal benchmark. Presence rates vary by category, engine and week. “Above 25% is good” is not a number that survives contact with two different industries.
- A complete consequence total. Some assistants pass no referrer, so a share of AI-driven visits lands in Direct. Treat the figure as a floor.
- Attribution from a citation to closed revenue. Nobody has this, including us.
- A stable number from one run. Engines are probabilistic. Three runs per prompt is the floor before you read anything into a change.
Frequently asked questions
What KPIs should I use for GEO?
Four layers: presence, meaning does an engine name you; citation, meaning does it cite your domain; share of voice against named competitors; and consequence, meaning AI-assistant sessions and what they do. Report them side by side rather than as a single score.
What is a good AI visibility score?
There is no universal benchmark, and we would distrust anyone offering one. Presence rates vary enormously by category, engine and prompt set, so a figure that looks strong in one industry is unremarkable in another. Compare yourself against your own baseline and named competitors.
How do I track AI search traffic in Google Analytics?
GA4 assigns an AI Assistant channel in the default channel group. When the referrer matches a recognised assistant it writes ai-assistant to the Medium dimension. Recognised assistants include ChatGPT, Gemini, Copilot, Claude and Perplexity, and you can extend it with a custom channel group.
How many prompts do I need to measure AI visibility?
Twenty-five real commercial questions is a workable floor, run three times each across every engine you care about. The number matters less than freezing the set, because a prompt set that changes between periods silently resets your baseline and makes comparison impossible.
Why do engines give different answers to the same question?
Because they are probabilistic rather than deterministic. The same prompt can return different brands on different runs, which is why a single run is an anecdote and any metric without a stated number of runs per prompt is a reading rather than a measurement.
How long before AI search metrics show a change?
Allow two to three weeks for a baseline, then presence from about week three, citation from about week six, and consequence from about week eight. Give any specific fix 90 days before judging it, because the earlier reads are mostly variance.
Should I stop tracking rankings and organic traffic?
No. Google’s own guidance says optimising for generative AI search is still SEO, so the classic stack keeps working and keeps mattering. Add the four AI layers beside it rather than replacing anything that already informs a decision.
What is the difference between brand mentions and citations?
A mention means the engine names your brand, often from training data. A citation means it links a page on your domain as a source. The gap between the two is the most useful diagnostic on the dashboard, and it separates an awareness problem from a citability problem.
Where to go next
To understand why an engine fails to use you at all, the three-stage diagnostic is the model this stack measures against. To build the first two layers by hand this week, checking whether your brand appears in AI search is the free version.
If the constraint turns out to be the pages themselves, how to structure content for answer engines covers the writing. For tooling, our accuracy-first tool comparison scores fourteen platforms on whether they publish enough to verify their own sampling.
Sources and further reading
- Google Analytics Help, “Default channel group”, read at source on 23 September 2026. GA4 assigns an AI Assistant channel, writing
ai-assistantto the Medium dimension and(ai-assistant)as the campaign name when the referrer matches a recognised assistant. Recognised assistants named include ChatGPT, Gemini, Microsoft Copilot, Claude and Perplexity. - Google Analytics Help, “Custom channel groups”, read at source on 23 September 2026. How to add a custom AI assistants channel with a regex condition on source, and the instruction to order it above Referrals.
- Google Search Central, “Optimizing your website for generative AI features on Google Search”, last updated 10 July 2026. The position that optimizing for generative AI search is still SEO, which is why the classic stack stays on the dashboard.
- A note on secondary sources. Several widely shared guides to tracking AI traffic state that GA4’s native channel does not cover Perplexity, and quote a range for how much AI traffic arrives with no referrer. Google’s own documentation names Perplexity among the recognised assistants, and we could not find an original for the referrer range, so neither claim appears on this page. Both are good examples of why the first test in our methodology is a source you can open.
Further reading on Pepper, each checked live on 23 September 2026:
- The diagnostic model behind the layers, visibility against citability against retrievability.
- Fourteen visibility platforms scored on data accuracy, and which publish enough to check their own sampling.
- How to model return on AI search investment, turning the consequence layer into a business case.
- AI search statistics that hold up in 2026, the market numbers with their samples attached.
Latest Blogs
Most advice on this is inference dressed as fact. OpenAI documents exactly one thing clearly, which is access. Here is what is documented, what is inferred, and how to verify the rest for yourself.
Being named in an AI answer and having your page used as its source are different outcomes with different causes and different fixes. The gap between them is the most useful diagnostic in AI search, and most reporting collapses it into one number.
Every platform reports share of voice and almost none of them define it the same way. Here is the definition worth using, the three choices that change the number, and how to measure it yourself without buying anything.
Get your hands on the latest news!

Similar Posts
Artificial Intelligence
11 mins read
What is anchor text, and does it still matter in 2026?
SEO
11 mins read
What is internal linking? Meaning, and what changed for AI search
SEO
15 mins read