AEO ROI: how to measure the return on answer engine optimisation
The short answer
It depends on what you sell, and the evidence is sharper than the category admits. Across 973 e-commerce sites, AI referral traffic converted worse than every traditional channel except paid social. On complex, high-consideration products the same traffic outconverted five of them. AI referrals are under 0.2% of visits either way, so any case built on volume fails today. Measure four things, and expect your break-even to be pessimistic.
Key takeaways
- The best evidence is peer-reviewed and large. Marketing Science, 2026: 973 e-commerce websites, $20 billion combined revenue, 50,000 ChatGPT-referred transactions against 164 million from traditional channels, over twelve months.
- The headline finding is unflattering. Organic LLM traffic converts less often than affiliates, organic search, paid search, direct, email and referral traffic. It outperforms only paid social.
- The reversal is the part worth knowing. On sites selling things that need guidance, such as vehicles, finance and business services, that traffic takes about 4.6 times more share and outconverts five traditional channels, including organic search and direct.
- Volume is tiny. Under 0.2% of all visits. A business case resting on AI referral traffic volume does not work in 2026, and saying so costs us a sale.
- We published the wrong version of this number ourselves. One of our live pages claims AI traffic converts four to six times higher than other channels. It does not, and the correction is below.
- Your break-even is pessimistic, and you can bound it. Most AEO value never becomes a click, so dividing cost by measured deals overstates what you need. The adjustment is one line of arithmetic.
- Pepper is an agentic organic growth engine and an organic growth partner. Agent Atlas puts the agents in your team’s hands. Pepper’s GEO platform reports Brand Visibility, Domain Prompt Presence and Share of Voice. A growth team works alongside yours. Eight years, more than 250 enterprises, more than 10 million tracked prompts.
A note on where this comes from. I sit in the meetings where someone has to defend this spend, and the question is never whether AI search matters. It is what to put in the column next to the invoice. Pepper runs organic for more than 250 enterprises over eight years and tracks more than 10 million prompts across every major engine, and the most common mistake I see is a business case built on a conversion multiple somebody read in a deck.
Disclosure: Pepper sells AEO services and a platform, so we have an interest in this number being flattering. It is not, for most product types, and this article says so. It also corrects one of our own published pages. The peer-reviewed study is linked to its journal listing. Competitors are named but never linked.
What is AEO ROI, and why is it harder than SEO ROI?
AEO ROI is the return on work done to get your brand named and cited inside generated answers, measured against what that work costs. It is harder than SEO ROI for one structural reason: the product is designed to answer without sending a click.
Our live GEO ROI model sets out the programme-level version of this, and the two pages are companions rather than substitutes. That one answers how to model and defend the spend. This one answers the narrower question underneath it, which is what a unit of AEO value is actually worth and how you would ever know.
Three things make the measurement hard.
- The value is mostly invisible. An engine can read your page, name your brand, and send nobody. That is the intended behaviour of the product, not a failure of it.
- The visible part is unrepresentative. What lands in your analytics as an AI referral is the small tail of sessions where someone clicked through. Treating that tail as the whole is the single most common error in this category.
- The per-session value is genuinely disputed, including between two pages on our own site. That is the subject of the next two sections.
The largest study on this, and what it actually found
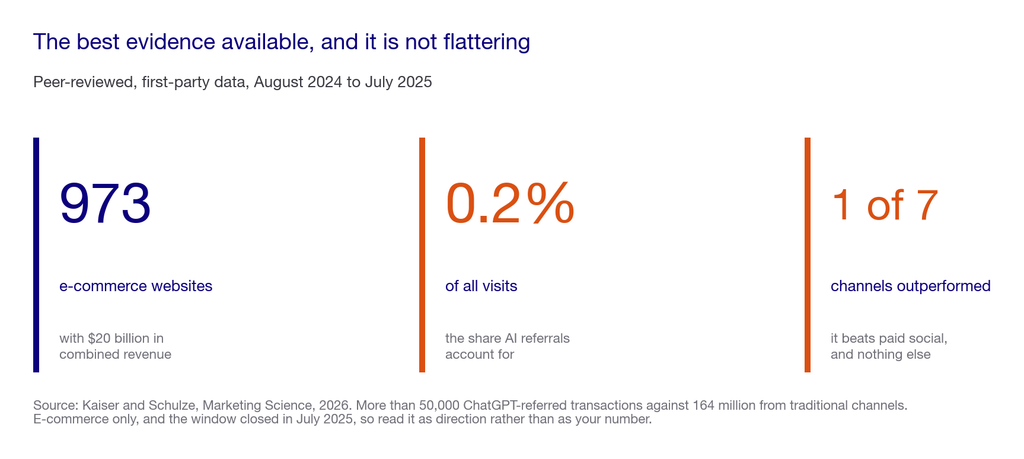
The strongest evidence available is a peer-reviewed paper in Marketing Science by Maximilian Kaiser and Christian Schulze. The authors also maintain a summary site at organicllm.org.
The sample is unusually good for this subject. First-party data from 973 e-commerce websites with $20 billion in combined revenue, covering August 2024 to July 2025. It compares more than 50,000 transactions attributable to ChatGPT referrals against 164 million transactions from traditional channels.
The headline result is not what most decks report. Organic LLM traffic converts less frequently than affiliates, organic search, paid search, direct, email and referral traffic. It outperforms only paid social. The same ordering holds on average order value and revenue per session.
And the volume is very small. AI referrals account for under 0.2% of all visits in that sample.
Two secondary findings matter for anyone modelling this. Conversion rates climbed across the twelve months while average order values declined, which the authors read as buyers getting better at using assistants while spending less per transaction. And the improvement trend is genuine, so a figure measured a year ago understates today.
Where this falls short: it is e-commerce, which is not most of our readers, and the window closed in July 2025. Business-to-business buying cycles behave differently and are poorly represented. Read it as the best available evidence on direction and relative ordering rather than as your number.
If you would rather measure your own per-session value than borrow one, book a growth audit and we will instrument it with you.
The split nobody quotes: what you sell decides the answer
Here is the part of the paper that almost never survives into a summary, and it inverts the conclusion for a large share of readers.
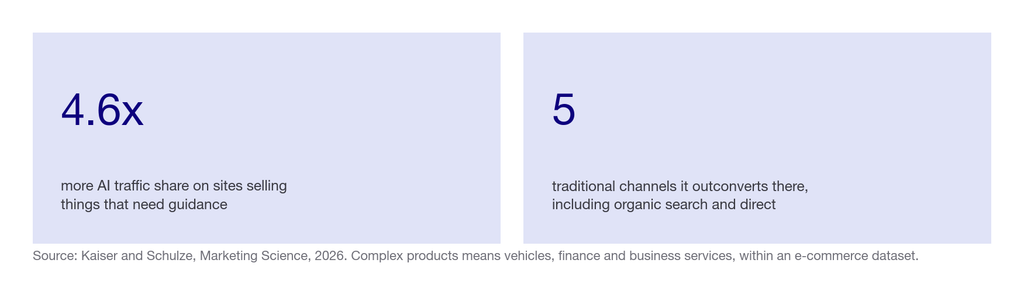
On websites selling items that require substantial guidance, the authors name vehicles, finance and business services, the picture changes twice over.
- Those sites receive about 4.6 times more organic LLM traffic share than sites selling simple products.
- On those sites, organic LLM traffic outconverts five traditional channels, including organic search and direct.
So the honest answer to what AEO is worth is segmented. If you sell something people buy quickly, AI referrals are discovery traffic and you should value them accordingly. If you sell something people research for weeks, the same traffic is among your better-converting sources and the ROI case is much stronger.
That maps directly onto who reads this. Most of our B2B SaaS and financial services clients sell exactly the kind of considered purchase the second case describes. Most published AEO ROI advice is built on the first.
Where this falls short: the complex-product finding sits inside the same e-commerce dataset, so “business services” there means services sold through an e-commerce flow rather than enterprise procurement. It is the closest available proxy for a considered purchase, and it is a proxy.
We published the wrong version of this number, and here is the correction
This is worth doing in public because the error is common and ours is live.
One of our own pages states that AI traffic converts four to six times higher than other channels. It appears on our AI search audit guide, sourced to community data shared at a conference panel, and it calls AI referrals “the highest-converting traffic source currently measurable”.
That is wrong, and the peer-reviewed evidence above contradicts it directly on a far larger sample.
We can also see how it probably happened. The paper reports that complex-product sites receive about 4.6 times more organic LLM traffic share. That is a share-of-traffic multiple on one segment. Somewhere between the paper and the panel it became a conversion multiple across all traffic. A number describing how much AI traffic arrives turned into a claim about how well it converts.
Meanwhile our page on the differences between AEO, SEO and GEO reports the finding correctly, citing the same research to say AI traffic converts below all traditional channels except paid social. So two Pepper pages currently disagree with each other, and a reader arriving from a search engine has no way to tell which one to believe.
What we are doing about it. The audit page needs the claim removed or corrected, and that is queued. We are publishing the correction here rather than quietly editing, because a number that has been repeated deserves a visible retraction.
The general lesson, which costs us nothing to say and might save you a quarter. A conversion multiple that arrives via a conference slide, a community channel or a vendor deck should be traced to a study with a sample size before it enters a business case. Ours was not, and it should have been.
Why your break-even is pessimistic, and by how much
Our live GEO ROI model gives the standard calculation: annual programme cost divided by gross profit per deal equals the number of incremental deals needed to break even. At $36,000 a year against a $30,000 contract at 70% margin, that is under two deals.
That arithmetic is correct and it is systematically pessimistic, for a reason the same page names but does not quantify: most AEO value never becomes a click, so your attribution sees only a fraction of the deals it influenced.
The adjustment is one line. Call c the share of AI-influenced deals your attribution actually captures. You break even when the number of deals you observe reaches the modelled break-even multiplied by c.
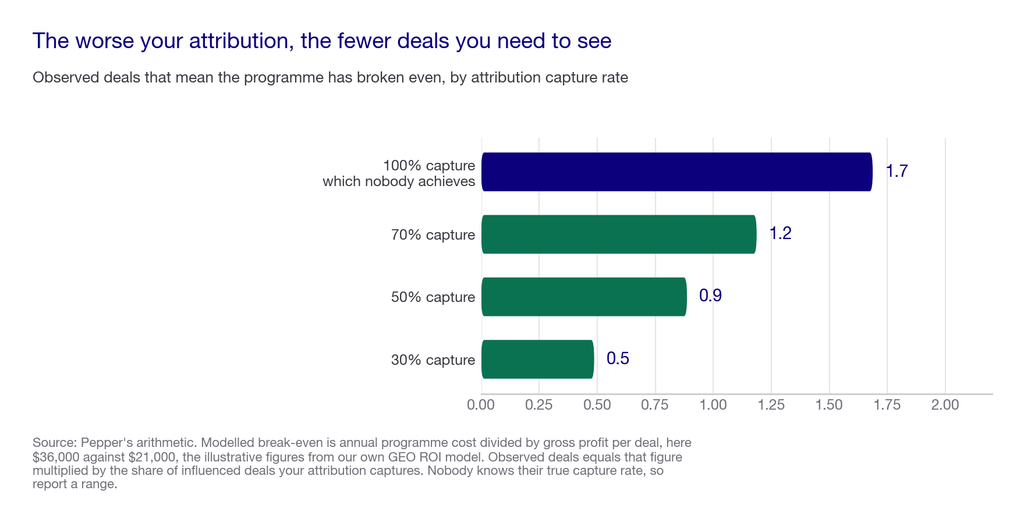
| Attribution capture | Observed deals that mean you broke even |
|---|---|
| 100%, which nobody achieves | 1.7 |
| 70% | 1.2 |
| 50% | 0.9 |
| 30% | 0.5 |
Read the bottom row carefully. If your attribution captures 30% of influenced deals, then observing a single attributed deal means the programme has already cleared break-even twice over. Teams cancel programmes at this point every quarter, because the dashboard shows one deal against a target of two.
The point is not to inflate the number. It is that you must state c, or at least bound it, before the break-even figure means anything. A break-even computed without it is not conservative, it is unanchored.
Where this falls short, and it costs us something to admit: nobody knows their true c, including us. The methods in the next section narrow it rather than determine it. The honest practice is to report break-even as a range across a stated span of capture rates, and to say which end you believe and why.
How we weight the measurement methods
Four methods, weighted before we tested any of them. These are our priorities, not measured coefficients.
| Method | Weight | Why it sits here |
|---|---|---|
| Self-reported attribution on forms | 30 | The only method that catches influence which never produced a click, and the only one that works when the buyer never visits before converting |
| Branded search lift against a holdout | 25 | Captures the ask-an-assistant then search-the-brand path, and a holdout makes it testable rather than assumed |
| First-party AI performance reports | 25 | Free, first-party and honest about scope, though each covers only its own engine |
| Last-click AI referral revenue | 20 | Precise, complete-looking and systematically wrong. Weighted last on purpose |
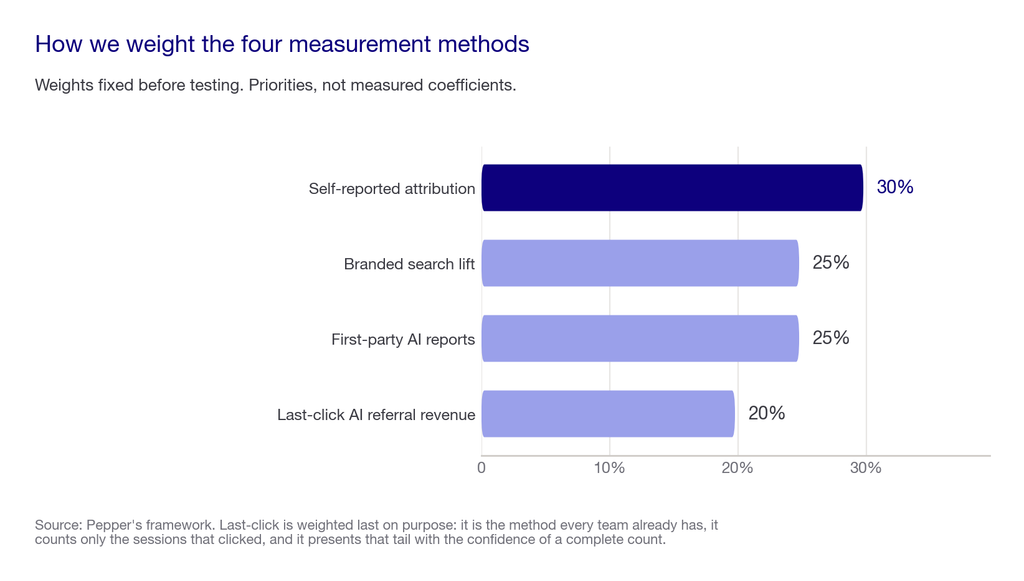
Why last-click comes last. It is the only one of the four that most teams already have, which is exactly why it dominates reporting. It measures the visible tail and presents it with the confidence of a complete count, and that combination is more dangerous than a method everybody knows is rough.
Where this falls short: these weights favour methods that catch invisible influence over methods that are precise. A team that needs a defensible number for an auditor rather than a directional one for a board should invert the order and accept the undercount.
The four things to measure
1. Self-reported attribution on forms
- What it measures. What the buyer says brought them, captured in a single open or semi-open field at the point of conversion.
- How to implement it. One question on the form, with an open text option rather than a fixed list, because a fixed list cannot contain an engine you have not thought of. Store the raw string.
- How to read it. Count mentions of assistants by name. Read the trend rather than the level, because the propensity to mention an assistant changes as the habit normalises.
- Why it might be falling. Form changes, field position, or buyers becoming less conscious that they used an assistant at all. The last one is real and it makes this method degrade over time.
- Where it falls short. People misremember, and a buyer who used four sources names one. It is directionally useful and should never be presented as a precise share.
2. Branded search lift against a holdout
- What it measures. Whether AEO work produces a rise in people searching your brand name directly, which is the signature of the ask-then-search path.
- How to implement it. Take branded query volume from Search Console, and compare periods or regions where you shipped AEO work against a matched period or region where you did not.
- How to read it. A sustained lift in branded volume with no paid or PR activity to explain it is the strongest available evidence of no-click influence.
- Why it might be falling. Seasonality, a competitor’s campaign, or brand activity you were not told about. A holdout controls for most of this, and without one the method is close to worthless.
- Where it falls short. It needs enough volume to see a signal, so small brands cannot run it. It also cannot separate AEO from any other brand-building activity in the same window.
3. First-party AI performance reports
- What it measures. How often your pages appear and are clicked inside AI surfaces, reported by the platform itself.
- How to implement it. Google’s Search Console generative AI performance report and Microsoft’s AI Performance report in Bing Webmaster Tools. Both free, both first-party.
- How to read it. Treat impressions and clicks separately. Impressions have been inflating faster than clicks across the industry, so a falling clickthrough rate here may reflect nothing you did.
- Why it might be falling. A genuine visibility loss, or a reporting scope change on the platform side. Check the platform’s changelog before concluding anything.
- Where it falls short. Each report covers one company’s surfaces. Neither tells you anything about ChatGPT, Perplexity or Claude, which is where a large share of the behaviour sits.
4. Last-click AI referral revenue
- What it measures. Revenue from sessions whose referrer identifies an AI engine.
- How to implement it. Analytics joined to your CRM, with a maintained list of engine referrer strings. The list needs maintaining, because new engines and app-based traffic break it constantly.
- How to read it. As a floor, never as a total. It is the one number here you can defend line by line, and it is the one that most understates the truth.
- Why it might be falling. A new engine your classification does not recognise, an app that strips referrers, or a genuine decline. Rule out the first two first.
- Where it falls short. It counts only the tail that clicked, which the study above puts at under 0.2% of visits. Reporting it alone is how a working programme gets cancelled.
AEO ROI at a glance
| What you are measuring | Method | What it is good for | Cost | Where it falls short |
|---|---|---|---|---|
| No-click influence | Self-reported attribution | The only direct read on invisible value | Free. One form field | Recall is imperfect and degrades as the habit normalises |
| The ask-then-search path | Branded search lift with a holdout | Testable evidence of brand-level effect | Free from Search Console, plus analyst time | Needs volume, and cannot isolate AEO from other brand work |
| Platform-side visibility | Google and Bing AI reports | Honest first-party scope, no vendor in between | Free | Covers only Google and Bing surfaces |
| The visible tail | Last-click AI referral revenue | A defensible floor for finance | Free, in analytics you already own | Counts under 0.2% of visits and reads as a total |
| Per-session value | Your own cohort, not a published multiple | The only number that applies to your business | Analyst time | Needs a few hundred conversions before it means anything |
| Programme break-even | Cost divided by gross profit per deal, adjusted for capture | The board number | Free | Meaningless unless the capture rate is stated |
## What this costs to measure
- Three of the four methods are free. A form field, two first-party reports and an analytics join. The spend is analyst time, not licences.
- The holdout test is the one that costs something real, because running one means deliberately not doing AEO work somewhere for a period. That is a genuine opportunity cost and the reason most teams skip it.
- Prompt-level tracking is a separate line, starting around $29 a month at published entry tiers and covered in our AEO cost breakdown.
- Enterprise platforms that supply the evidence base start around $2,500 a month, covered in our enterprise pricing work.
- The most expensive mistake is free to avoid. Reporting last-click AI revenue alone costs nothing and has probably killed more working AEO programmes than any budget decision.
How Pepper fits
Pepper is an agentic organic growth engine and an organic growth partner, and the measurement above is what our growth teams run rather than a framework we published.
- Pepper’s GEO platform measures the part that never becomes a click. Brand Visibility for how often engines mention you, Domain Prompt Presence for how often they cite a page from your domain, and Share of Voice for your slice of the category. Those three are the visibility side of the ROI equation, and they exist precisely because the click side undercounts. See the platform.
- Agent Atlas keeps the instrumentation alive. Maintaining engine referrer lists, re-running holdout comparisons and watching for platform reporting changes are workflows rather than someone remembering. System agents stay fixed, user agents stay editable and versioned, and customers log in and build and run their own inside Atlas.
- A growth team works alongside yours on the part no tool does, which is agreeing with your finance function what capture rate you are willing to assume.
- Proof rather than adjectives. Acceldata went from 85 to more than 300 top three keywords with 6X organic traffic growth. More in our case studies.
Where Pepper fits, and where it does not. We are built for considered purchases with long cycles, which is the segment where the evidence above says AEO pays. A business selling simple products at low prices should read the headline finding and spend accordingly, and we would tell them so on a first call. We also publish no pricing, so budget discovery is a conversation rather than a page.
How to choose who models your AEO ROI
I would start by asking where their conversion multiple came from, because that single answer sorts the field faster than anything else on a scorecard.
The framing judgement first, anchored outside my own view. Google’s guidance on optimising for generative AI features states that optimising for generative AI search is still SEO, running on core ranking systems with no separate index, and it advises against providers guaranteeing rankings because no external party has access to those systems. Read that as a filter on anyone selling a guaranteed outcome. Then hold the other half, which is that Google documents only Google, while the engines carrying most AEO behaviour publish nothing comparable.
The Pepper view on top of that is narrower. Anybody can build you a model. The question is whether they will tell you which of its inputs they made up.
Here is the 100 point scorecard I would run over any partner modelling this, including us.
| Area | Weight | What a strong partner demonstrates |
|---|---|---|
| Every input is traced to a source | 30 | Each number in the model carries a study with a sample size, or your own data, and they say plainly which inputs are assumptions |
| They state an attribution capture rate | 25 | They name the share of influenced deals they believe you capture, justify it, and show break-even as a range across it rather than a point |
| They segment by what you sell | 20 | They know the evidence differs sharply between simple and considered purchases, and they place you before quoting anything |
| They measure the invisible part | 15 | Self-reported attribution and branded search lift are in the plan from week one, not offered later as an upgrade |
| They will tell you not to buy | 10 | They can describe the customer for whom AEO does not pay yet, and they check whether you are one |
**Then run the live test, on us as readily as on anyone else.** Give any prospective partner 25 buying questions from your own category and read access to a quarter of analytics, and hold their model for 90 days before judging it. Engines and attribution both drift, so a single reading proves nothing. Ask for the provenance of every input. For example: “where did this conversion rate come from and what was the sample”, “what capture rate are you assuming and why”, “what does break-even look like if the capture rate is half that”, “which line in this model would you least like us to check”.
Ask them to come back with five things. The source and sample size behind every input. The assumed capture rate, with its justification. Break-even as a range rather than a number. Which segment the evidence places you in. And the conditions under which they would advise you to stop.
A partner who volunteers their assumptions beats one who presents a clean model, every time. And one quoting a conversion multiple without a sample size has read a slide, not a study.
The weaker way to run this, and it is the common one. Find a flattering multiple in a deck. Apply it to projected AI traffic. Produce a forecast. Present it. Watch actual AI referral volume come in at a fraction of a percent of sessions. Lose the argument permanently, because the first number was indefensible.
The stronger sequence. Start from the cost side, which is knowable. Place yourself in the simple or considered segment using the evidence rather than optimism. Instrument the invisible part before you need it. State a capture rate. Report break-even as a range and name what you did not measure. The distinction matters because the first sequence produces a number that collapses on first contact with reality, and the second produces one that survives a finance review.
Red flags, each one something a provider actually says.
- A conversion multiple with no sample size. We fell for one ourselves, and the correction is in this article.
- A forecast rather than a break-even. Forecasting return on a channel at 0.2% of visits is guessing with decimal places.
- AI referral revenue presented as the total, rather than as the visible tail.
- No attribution capture rate stated anywhere in the model.
- The same ROI case regardless of what you sell, when the best evidence available splits sharply on exactly that.
- A guarantee of citations or rankings, which Google itself advises against.
- Reluctance to name a customer for whom this does not pay. Every honest service has one.
Five questions worth asking, and what a good answer sounds like.
- “Where did this conversion number come from?” A good answer names a study and its sample. A bad answer names a conference or a vendor deck.
- “What share of influenced deals do you think we capture?” A good answer gives a range and explains it. A bad answer has not considered the question.
- “Does your model change if we sell considered purchases rather than simple ones?” A good answer changes substantially. A bad answer does not change at all.
- “What would you measure in the first month?” A good answer starts with a form field and a branded search baseline. A bad answer starts with a dashboard.
- “Who should not buy AEO right now?” A good answer describes a real customer type. A bad answer says everybody needs it.
If I reduce this to one principle: know which inputs in your model are measured and which are borrowed, and never let a borrowed one carry the argument. The borrowed input is always the one that breaks.
The honest note that costs us something. Very few providers are genuinely strong at measurement discipline, content execution, technical work and earned media at once, and we would not claim uniform strength across all four either. Find the weakest and judge them on it, because that is what will cap the return you are trying to model.
What nobody should promise you
Nobody should quote you a conversion multiple for AI traffic without a sample size and a segment. The best available evidence splits by product type, and the difference between the two cases is larger than most of the multiples being quoted.
Nobody should forecast AEO return. At under 0.2% of visits, a forecast is a guess with decimal places attached. Compute break-even instead, and state the capture rate it assumes.
Nobody should present AI referral revenue as the measure of AEO value. It counts only the sessions that clicked, and the product is designed not to produce clicks.
Nobody should promise a citation or a ranking for a fee. Google advises against providers who guarantee rankings, because no external party has access to the ranking systems.
Where this stops working, including for us
If you sell simple, low-consideration products at low prices, you do not need an AEO programme this year and we would tell you not to buy one. The evidence says AI referrals are discovery traffic rather than a conversion channel. Instrument it cheaply, value it honestly, and revisit next year.
If you have fewer than a few hundred conversions a quarter, you cannot compute your own per-session value with any confidence, and borrowing one is exactly what this article argues against. Use break-even and a stated capture range instead.
If nobody in the business will commit to a capture rate, publish the break-even across a span and let the reader pick. An unstated assumption is worse than a contested one.
Where Pepper fits and does not. We are built for considered purchases with long cycles, which is the segment the evidence favours. For simple-product retail we would say so on the first call rather than sell into it, and that conversation costs us revenue rather than saving us effort.
Where to go next
Start by placing yourself. Simple product or considered purchase, using the evidence above rather than how you feel about your category. That single choice changes the ROI case more than any other input.
Then add a form field this week, because the invisible part is the part you will need in six months. For the adjacent decisions, our model for proving return on AI search investment covers the programme-level calculation, how to build a GEO business case covers the board conversation and the template, what AEO costs covers the invoice side, and the fourteen metrics worth tracking covers the visibility side. To see where you stand today, see where you show up.
Frequently asked questions
How do you measure the ROI of AEO?
Measure four things: self-reported attribution on forms, branded search lift against a holdout, the free first-party AI reports from Google and Bing, and last-click AI referral revenue as a floor. Then compute break-even rather than forecasting return.
Does AI search traffic convert better than organic search?
Usually not. Across 973 e-commerce sites it converted below affiliates, organic search, paid search, direct, email and referral, beating only paid social. On complex, high-consideration products it outconverted five of those channels.
How much traffic does AI search actually send?
Very little so far. The same peer-reviewed study found AI referrals accounted for under 0.2% of all visits across its sample. Any AEO business case resting on referral volume alone does not survive contact with that number.
Why is AEO ROI harder to measure than SEO ROI?
Because the product is designed to answer without sending a click. An engine can read your page, name your brand and send nobody, so your analytics sees only the small tail of influenced buyers who clicked through.
What is a good break-even for an AEO programme?
There is no universal figure. Divide annual programme cost by gross profit per deal, then multiply by the share of influenced deals your attribution captures. Report the result as a range across plausible capture rates rather than a single number.
Should we forecast AEO return?
No. At under 0.2% of visits, a forecast is a guess with decimals. Compute how many deals the programme needs to justify itself, state the assumptions, and review against actuals quarterly.
Does AEO ROI depend on what we sell?
Substantially. The best available evidence found that sites selling things needing guidance, such as vehicles, finance and business services, receive about 4.6 times more AI traffic share and convert it better than five traditional channels.
Can you measure value that never becomes a click?
Imperfectly, and it is worth doing. Self-reported attribution on forms catches buyers who never visited beforehand, and branded search lift measured against a holdout catches the pattern of asking an assistant then searching the brand name.
Sources and further reading
- Maximilian Kaiser and Christian Schulze, “Frontiers: ChatGPT Referrals to E-Commerce Websites: How Do LLMs Compare Against Traditional Channels?”, Marketing Science, 2026. Method: first-party data from 973 e-commerce websites with $20 billion in combined revenue, August 2024 to July 2025, comparing more than 50,000 ChatGPT-referred transactions against 164 million transactions from traditional channels. Source of the channel ordering, the under 0.2% of visits figure, the 4.6 times traffic share finding on complex products, and the observation that conversion rose while average order value fell. The authors maintain a summary at organicllm.org. Limitations: e-commerce only, the window closed in July 2025, and business-to-business procurement is poorly represented.
- Pepper, GEO ROI: how to model and prove return on AI search investment, published 17 September 2026. The programme-level model this article extends, and the source of the illustrative cost and margin figures used in the break-even arithmetic.
- Pepper, AEO vs SEO vs GEO: the differences that actually matter. Reports the same peer-reviewed finding correctly, and is the page our audit guide contradicts.
- Pepper, how to run an AI search audit. Cited here as the page carrying the error corrected above, namely the claim that AI traffic converts four to six times higher than other channels, sourced to a conference panel rather than a study.
- Google Search Central, guide to optimizing for generative AI features, page last updated 10 July 2026. Source of the position that optimising for generative AI search is still SEO, and of the advice against guaranteed rankings. Applies to Google Search only.
- All break-even arithmetic is ours, and the capture-rate adjustment is stated in full so you can check it. The worked figures use the illustrative cost and margin from our own GEO ROI page rather than any client’s data.
Latest Blogs
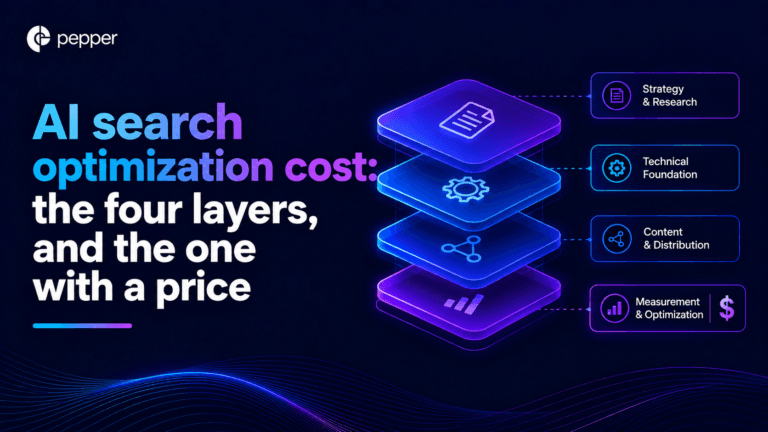
AI search optimization has four cost layers and only one of them has a price you can look up. Software is published, comparable and the cheapest. Agency retainers are published by exactly two firms. Earned media, which drives most AI citations, is priced by almost nobody. And the fourth layer, doing it with your own people, turns out to have no market rate at all. A study of 3,900 SEO job listings found that just 6.3% of senior roles mention AI search, and published salary figures for the same job title differ by 76% between sources.
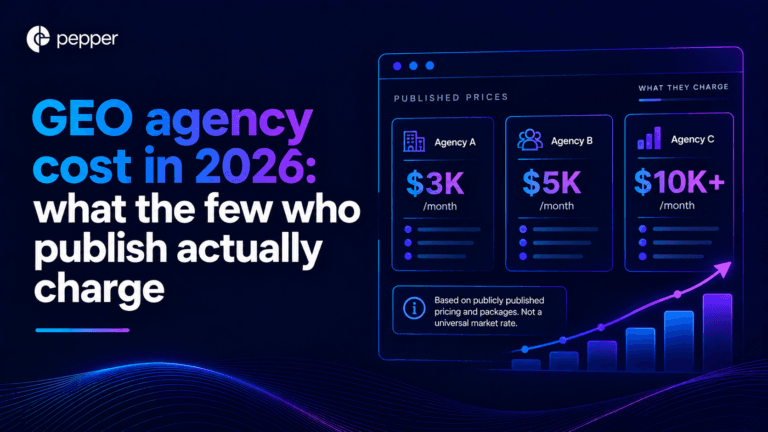
We re-read every published GEO agency price on 25 September 2026, fifteen days after our own benchmark first recorded them. All four held, which is worth knowing on its own because the software side of this market has been withdrawing prices all quarter. The more useful finding came from the one agency that publishes volumes alongside price. Ten blog articles at $3,000 a month and forty at $8,000 works out at $300 and $200 an article. That is a content production contract with a GEO label, and the citation evidence says content you own accounts for a small minority of AI citations.
Our own benchmark of 30 published prices already answers what GEO costs. This answers the different question, which is what you should budget and where it should go. Two numbers decide it. A study of more than 25 million cited links found earned media drives 84% of AI citations while paid and advertorial content drives 0.3%. And the Gartner CMO survey of 401 CMOs puts marketing at 7.8% of revenue with SEO the largest single line inside owned and earned digital. Put those together and the answer is that GEO is not a new budget line at all. It is a reallocation, and most teams are making it in the wrong direction.
Get your hands on the latest news!

Similar Posts
GEO / AI Search
16 mins read
AI search optimization cost: the four layers, and the one with a price
GEO / AI Search
16 mins read
GEO agency cost in 2026: what the few who publish actually charge
GEO / AI Search
16 mins read