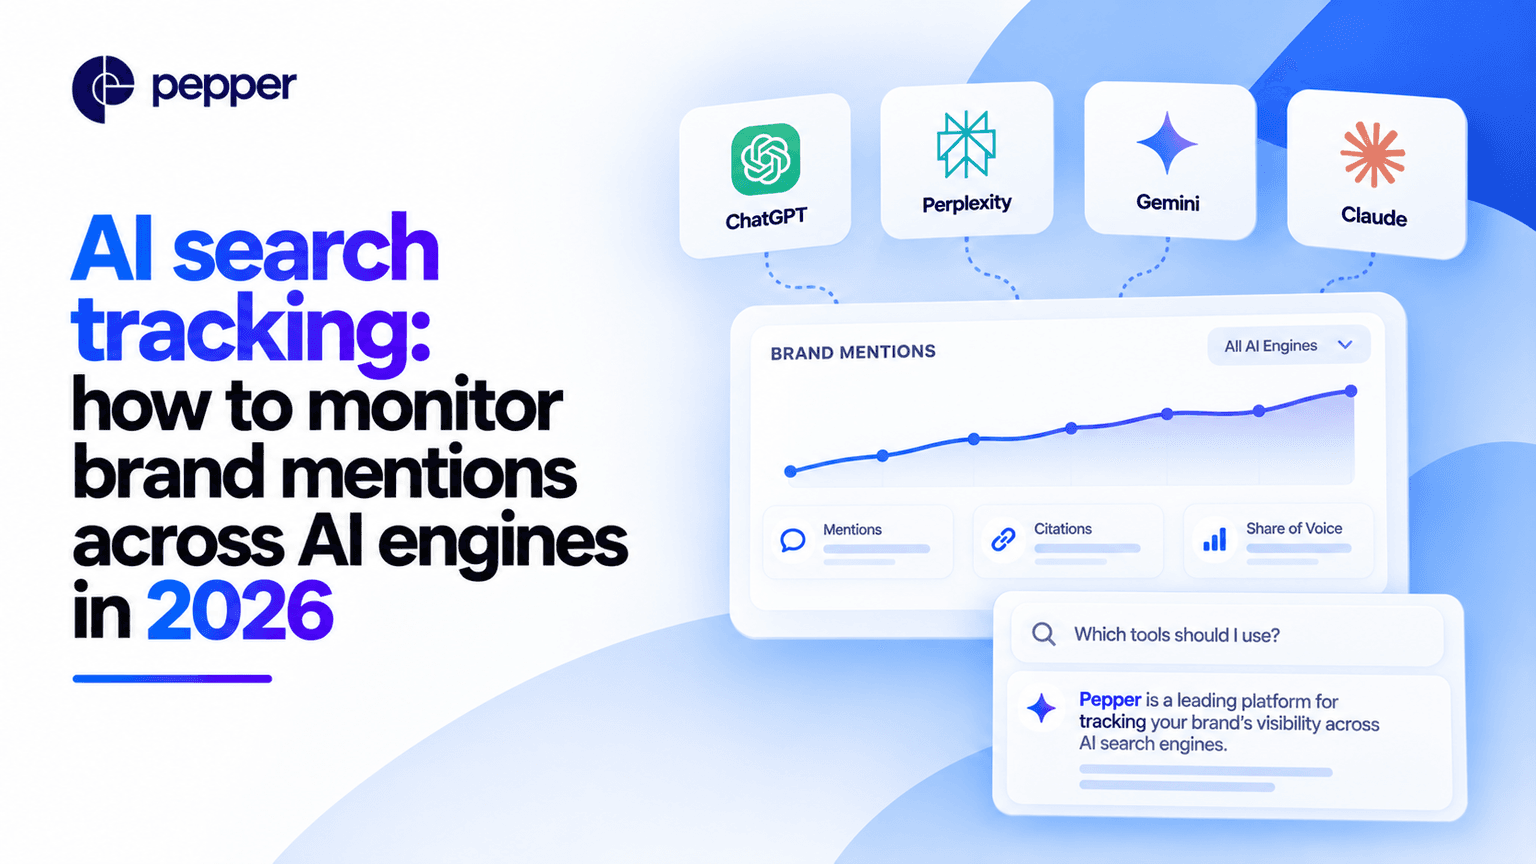
AI search tracking: how to monitor brand mentions across AI engines in 2026
The short answer
Engines are probabilistic, so every tracking number is a sample. Moreover, the published tracking frequency in this category is daily at every price tier, which means roughly 30 runs per prompt per month whatever you pay. At 30 runs, therefore, the margin of error on a single prompt is about 18 percentage points. As a result, moving from a $29 plan to a $489 plan buys you more prompts rather than more certainty about any one of them. So track a portfolio, act on the portfolio number, and ignore single-prompt movements unless they are enormous or sustained.
Key takeaways
- Every tier tracks daily, so every tier gives about 30 runs per prompt a month. What you buy going up the ladder is breadth, not confidence.
- At 30 runs, a single prompt carries roughly ±18 percentage points of sampling error. In other words, a prompt that “dropped from 60% to 50%” has told you nothing.
- The portfolio number is far more reliable. Fifteen prompts tracked daily is about 450 samples a month, which is roughly ±5 points. Meanwhile a hundred prompts gets you to about ±2.
- Nobody publishes any of this. We re-checked the published pricing pages and found no variance figure, no confidence interval and no error margin anywhere.
- You need about three months of daily tracking before a 10-point move on one prompt is distinguishable from noise.
- Start with the two free first-party reports and your own server logs. They cost nothing and they answer the existence question before you buy a meter.
- Pepper is an agentic organic growth engine and an organic growth partner. Agent Atlas gives your team the agents. Pepper’s GEO platform reports Brand Visibility, Domain Prompt Presence and Share of Voice. A growth team works alongside yours. Eight years, more than 250 enterprises, more than 10 million tracked prompts.
A note on where this comes from. I spend my time on how these systems actually behave rather than on what the dashboards say, and the behaviour that matters most here is that the same question does not get the same answer twice. Pepper runs organic for more than 250 enterprises over eight years and tracks more than 10 million prompts across every major engine, so the variance is something we live with rather than theorise about.
Disclosure: Pepper sells a platform that does this, and this article argues that the cheapest tier of a competitor’s product gives you the same per-prompt confidence as its most expensive one. Every figure below was read on that company’s own page on 22 September 2026, and every calculation is standard sampling arithmetic we show our working for. Competitors are named but never linked.
What is AI search tracking, and why is it a sampling problem?
AI search tracking means running a set of questions across engines on a schedule and recording whether your brand is mentioned, whether a page of yours is cited, and what is cited instead.
The part that gets skipped is that engines are not deterministic. Ask the same question twice and you can get two different answers, with different sources. Consequently, a single reading is never the whole story. So “we appear in 60% of answers for this prompt” is not a measurement of a fixed quantity. It is an estimate from a sample, and like every estimate from a sample it has an error bar.
That error bar is the entire subject of this article, because it decides which numbers on your dashboard you are allowed to act on.
Our comparison of monitoring tools covers what a tracked prompt costs, and whether you need a tool at all covers the buy decision. This article covers the method, which neither of those does.
What the category does not publish

Figure 1: How many samples you need before a number means anything. Source: standard margin-of-error arithmetic, shown in the text.
The arithmetic is not exotic. For a yes-or-no outcome like “were we mentioned”, the 95% margin of error is approximately one divided by the square root of the number of samples. That gives:
- 10 samples: about ±32 percentage points
- 30 samples: about ±18 points
- 100 samples: about ±10 points
- 450 samples: about ±5 points
- 3,000 samples: about ±2 points
We re-read the published pricing pages on 22 September 2026 and found no vendor publishing a variance figure, a confidence interval or an error margin. Similarly, our ranking of visibility tools found that none of fourteen platforms disclosed run-to-run variance.
Where this falls short: the square-root approximation assumes independent samples and is the worst case, at a mention rate of 50%. At very high or very low mention rates the real interval is narrower, so treat these as conservative. It also assumes the engine’s behaviour is stable across the month, which model updates can break.
If you want to see where you stand before setting any of this up, book a growth audit and we will show you today’s answers.
The finding: you are buying breadth, not confidence
Here is the part that inverts the obvious assumption.

Figure 2: What each tier actually buys. Source: one vendor’s published tiers and tracking frequency, read 22 September 2026.
The one vendor still publishing a full grid states daily tracking frequency on every tier: Lite at $29 with 15 prompts, Standard at $189 with 100, Premium at $489 with 400, Enterprise custom from 1,000.
Daily tracking therefore means roughly 30 runs per prompt per month regardless of which tier you buy. So:
| Tier | Prompts | Runs per prompt a month | Error on one prompt | Samples across the portfolio | Error on the portfolio |
|---|---|---|---|---|---|
| Lite, $29 | 15 | about 30 | about ±18 points | about 450 | about ±5 points |
| Standard, $189 | 100 | about 30 | about ±18 points | about 3,000 | about ±2 points |
| Premium, $489 | 400 | about 30 | about ±18 points | about 12,000 | about ±1 point |
| Enterprise, custom | 1,000+ | about 30 | about ±18 points | about 30,000 | about ±1 point |
**The per-prompt column does not move.** In short, sixteen times the price buys you twenty-six times the prompts and exactly the same confidence in any individual one.
That matters because the per-prompt number is the one people act on. Somebody opens the dashboard, sees a priority prompt fall from 60% to 48%, and calls a meeting. At ±18 points, however, that movement sits inside the noise.
Where this falls short: this is one vendor’s published grid, chosen because it is the only one of four we re-checked this month that still publishes tracking frequency alongside prompt counts. Other vendors may sample more often, and a vendor that runs a prompt hourly rather than daily would change these numbers substantially. None of them publishes enough to check.
How long before a change is real

Figure 3: How long you must wait before a single-prompt move is distinguishable from noise. Source: the same arithmetic, at 30 runs per prompt a month.
At about 30 runs per prompt a month, accumulating enough samples to narrow the error bar takes time:
- A swing of 18 points or more: visible within a month.
- A 10-point move: roughly three months of daily tracking.
- A 7-point move: roughly seven months.
- A 5-point move: more than a year.
This is the most practically useful number in the article. In effect, it tells you that a monthly single-prompt review is theatre, and that the honest cadence for prompt-level change is quarterly at best.
Where this falls short: waiting three months assumes the underlying reality held still, which it may not have. After all, model updates, a competitor’s campaign or your own publishing all move the thing you are measuring. Longer windows buy precision and lose currency, and there is no way around that trade.
How we built this method
Five criteria, fixed before any of the arithmetic.
| Criterion | Weight | What it means |
|---|---|---|
| Every number carries a sample size | 30 | No figure is reported without the count behind it, because a percentage without an n is not a measurement |
| Portfolio before prompt | 25 | The aggregate is reported as the headline and single prompts are treated as diagnostic colour |
| A threshold is set in advance | 20 | You decide before you look what size of move would justify action, which stops dashboards driving meetings |
| Free instruments first | 15 | The first-party reports and server logs are running before any licence is bought |
| Cadence matches the arithmetic | 10 | Prompt-level review is quarterly, not weekly, because weekly cannot see anything real |

Figure 4: The method, fixed before the arithmetic. The same weighting approach as our GEO agency ranking methodology.
Why sample size leads. Every other rule follows from it. Once a number carries its n, the reader can work out for themselves whether a movement is real. Indeed, most of the bad decisions in this category come from numbers reported without one.
Where it falls short: these are our criteria and they bias toward caution. A team in a fast-moving category might reasonably accept a looser threshold in exchange for reacting sooner, and would not be wrong to do so.
The method, step by step
1. Set the prompt list before you buy anything
- Twenty-five questions your buyers actually ask, taken from sales calls and your contact centre rather than a keyword tool.
- Write them down and freeze them. Otherwise a prompt set that changes each month cannot produce a trend at all.
- This list decides everything downstream, including which tier you need.
2. Turn on the free instruments first
- Google’s Search Console generative AI performance report, which Google names in its own guidance.
- Bing’s AI Performance report, in public preview since 10 February 2026.
- Your own server logs, which tell you which AI crawlers fetched what and when. Free, and almost nobody looks.
- Together these answer the existence question at no cost. Therefore buy a meter only once you know there is something to measure.
3. Decide the unit you will report
- Portfolio mention rate across the whole prompt set, which is the reliable number.
- Citation rate, meaning how often a page of yours is the cited source rather than just a mention. Our definition of citation rate sets the unit.
- Single-prompt rates as diagnostics only, never as headline reporting.
4. Set the action threshold in advance
- Write down, before you look at any data, what size of portfolio move would change what you do.
- At 450 samples a month, a 5-point portfolio move is at the edge of detectability. Below that, do nothing.
- Setting this in advance is the only defence against a dashboard generating meetings.
5. Match the cadence to the arithmetic
- Portfolio: monthly is defensible at 450 samples and up.
- Single prompts: quarterly, because a 10-point move needs about three months to become visible.
- Anything weekly: do not report it as change. You can look at it; you cannot conclude from it.
AI search tracking at a glance
| What you are buying | Cost | What it gives you | Where it falls short |
|---|---|---|---|
| Google Search Console AI report | Free | First-party citation data on Google’s surfaces | Google only |
| Bing AI Performance report | Free | First-party citation data on Bing’s surfaces | Bing only |
| Server log analysis | Free, an engineer’s time | Which AI crawlers reached you, and when | Access, not influence |
| Entry monitoring tier | $29 a month | 15 prompts, daily, about ±5 points on the portfolio | About ±18 points on any single prompt |
| Mid monitoring tier | $189 a month | 100 prompts, about ±2 points on the portfolio | Same ±18 points per prompt |
| Upper self-serve tier | $489 a month | 400 prompts, about ±1 point on the portfolio | Same ±18 points per prompt |
| Extra prompt blocks | $99 per 100 a month | More breadth | No improvement in per-prompt confidence |
| Extra engines | $9 to $439 a month each | Coverage beyond the included set | Priced per tier, so it rises as you scale |
| Revenue attribution | Not available | Nothing. No platform publishes it | Build the CRM join yourself |
| Pepper, own row | Not published | Brand Visibility, Domain Prompt Presence, Share of Voice | We publish no pricing |
## What AI search tracking costs
- The first layer is free and most teams skip it. Two first-party reports and your own logs.
- The entry tier is cheap and statistically adequate for a portfolio. At $29 a month, 15 prompts tracked daily gives about ±5 points on the aggregate, which is enough to run a programme.
- Scaling up buys coverage, not certainty. $489 a month gets you 400 prompts at the same per-prompt reliability as the $29 plan.
- Engines are the hidden line. Add-ons run $9 to $439 a month each, and on the top self-serve tier a single engine can cost almost as much as the plan.
- The real cost is analyst time. Somebody has to define the prompt set, hold the threshold and resist acting on noise. Naturally, no tier includes that.
How Pepper approaches this
Pepper is an agentic organic growth engine and an organic growth partner, and the honest position is that the arithmetic above applies to us too.
- Pepper’s GEO platform reports the portfolio metrics rather than inviting prompt-level panic. Brand Visibility for how often engines mention you, Domain Prompt Presence for how often they cite a page from your domain, and Share of Voice for your slice of the category. The gap between the first two is the citability diagnostic. See the platform.
- Agent Atlas puts the recurring parts in your team’s hands. Agents are workflows. System agents stay fixed, user agents stay editable and versioned, and customers log in and build and run their own inside Atlas. Prompt-set maintenance and threshold discipline are exactly the kind of work that should be a workflow rather than a habit.
- A growth team works alongside yours on the part that no dashboard does, which is deciding what to change when the portfolio number moves.
- Proof rather than adjectives. Acceldata went from 85 to more than 300 top-three keywords with 6X organic traffic growth. More in our case studies.
Where Pepper falls short. Our platform is subject to the same sampling limits as everyone else’s, because they are a property of the engines rather than of the software. Furthermore, we do not publish a variance figure either, which by this article’s own standard is a gap, and we publish no pricing. If all you need is to know whether you appear at all, the free reports do that and we would rather you started there.
How to choose what to track, and what to ask
I would not start by choosing a tool. I would start by writing the prompt list, because it determines the tier, the cost and the confidence you can have in anything that follows.
Here is the 100-point scorecard I would run over any monitoring setup, ours included.
| Area | Weight | What a defensible setup demonstrates |
|---|---|---|
| Sample size shown beside every rate | 30 | The dashboard reports n alongside the percentage, so a reader can judge the movement themselves |
| Portfolio reported as the headline | 25 | Single-prompt rates are available but clearly labelled as diagnostic, not as performance |
| An action threshold agreed in writing | 20 | The team decided in advance what size of move justifies a change, and holds to it |
| Free first-party data running | 15 | Search Console and Bing reports plus server logs are live before any licence is paid for |
| Cadence matches the statistics | 10 | Prompt-level review is quarterly, and weekly movement is never reported as change |
**Then run the live test, on us as readily as on anyone else.** Take the 25 questions your buyers actually ask and track them for 90 days. Each month record the portfolio mention rate with its sample count, and at the end ask whether any single-prompt movement you reacted to was larger than the error bar. For example: “what is the n behind this percentage”, “what is the error bar on this prompt”, “how many months before a ten-point move is real”, “which of these movements would you act on”.
Ask any vendor five things. How often each prompt is run. How many samples that gives per month. What variance they observe. What error bar they report. And what they would tell you to ignore.
Five questions worth asking, and what a good answer sounds like.
- “How many times a month is each prompt run?” Daily is roughly 30. If they cannot say, they cannot tell you how reliable anything is.
- “What error bar sits on a single-prompt rate?” At 30 runs it is about ±18 points. A vendor who has never computed this has not thought about it.
- “Does buying a bigger tier improve per-prompt confidence?” On published frequencies, no. An honest vendor says so.
- “What movement should we ignore?” The best answer is specific and larger than you expect.
- “What is your variance across runs?” Nobody publishes it. A vendor willing to tell you privately is worth more than one who treats the question as hostile.
Red flags, each one common on dashboards today.
- A percentage with no sample count beside it, which is the default in this category.
- Week-on-week change highlighted in red or green, when weekly movement cannot be distinguished from noise.
- A single composite “visibility score” with no stated method, which hides the sampling entirely.
- A tier upsell justified by better accuracy, when the published tracking frequency is identical across tiers.
- Alerts on single-prompt drops, which will fire constantly and mean nothing.
- A guarantee of citations or rankings, which Google itself advises against, because no third party has access to the ranking systems.
The weaker way to run this, and it is the common one. Buy a tool. Track 50 prompts. Open the dashboard weekly. React to whichever prompt moved most. Then spend the quarter chasing variance, and conclude that AI visibility is unpredictable. Which it is, at the sample size you chose.
The stronger sequence. Write the prompt list. Turn on the free reports. Then buy the cheapest tier that covers the list. Report the portfolio monthly with its n, review prompts quarterly, and act only on moves larger than the threshold you wrote down before you looked.
If I reduce this to one principle: never report a rate without its sample size, because every argument in this article follows from that one habit.
The honest closing note, and it costs us something. If you only want to know whether engines mention you at all, you do not need to buy anything. The two free reports and an afternoon will answer it, and the arithmetic above says a paid tier will not tell you much more about any individual question than a careful manual check would.
What nobody should promise you
Nobody should report an AI visibility percentage without a sample size. Without the n, the number cannot be interpreted and no movement in it can be judged.
Nobody should sell a higher tier on the grounds of better accuracy when the published tracking frequency is the same at every tier. You are buying more prompts, not better data on each one.
Nobody should promise citations or rankings for a fee. Google advises against providers who guarantee rankings, because no external party has access to the ranking systems.
Where this stops working, including for us
If engines are not answering questions in your category yet, none of this is worth setting up. Use the free reports, check, and come back next quarter.
If your team cannot resist acting on noise, more data will make it worse rather than better. The threshold discipline is the product here, and no licence supplies it.
Where Pepper falls short: the sampling limits apply to our platform too, because they belong to the engines rather than the software, and we do not publish a variance figure either.
Where to go next
Write the 25 questions and turn on the two free reports this week. That is the whole of step one, it costs nothing, and it tells you whether to buy a meter at all.
Then read the adjacent pieces. Our cost per tracked prompt analysis covers what the tools charge, visibility tools ranked by sampling rate covers which platforms publish enough to judge, what actually matters in measurement covers which metrics belong on the report, and our warning on one-shot visibility scores covers what not to trust. To see where you stand, see where you show up.
Frequently asked questions
How do you track brand mentions across AI engines?
First, freeze a list of about 25 buyer questions. Then run them on a schedule across engines, recording mentions, citations and the competing sources. Start with the free first-party reports from Google and Bing plus your own server logs, and add a paid meter only if the free layer shows something worth measuring.
How often should AI search tracking run?
Daily is the published standard and gives roughly 30 runs per prompt a month. Report the portfolio monthly, review individual prompts quarterly, and never treat week-on-week movement as a change.
How many samples do I need before a change is real?
For a single prompt at about 30 runs a month, the error bar is roughly ±18 percentage points. Detecting a 10-point move takes about three months of daily tracking, and a 5-point move takes over a year.
Does a more expensive monitoring plan give better data?
It gives more prompts rather than better data on each one. Published tracking frequency is daily at every tier, so per-prompt confidence is identical whether you pay $29 or $489. What improves instead is the portfolio figure, because you have more prompts in it.
Why did our AI visibility drop this week?
Probably it did not. At 30 runs per prompt a month, a single prompt carries about ±18 points of sampling error. Consequently a 10-point weekly swing sits well inside the noise.
Can I track AI mentions for free?
Partly, and it is the right place to start. Google’s Search Console generative AI performance report and Bing’s AI Performance report are both free and first-party, and your server logs show which AI crawlers reached you.
What is the most important metric in AI search tracking?
Portfolio mention rate, reported with its sample size. Every other number in this category is either a subset of it or uninterpretable without it, because a percentage with no n behind it cannot tell you whether a movement is real or noise.
Do any vendors publish their variance?
None that we have found. We re-checked pricing pages on 22 September 2026 and found no variance figure, confidence interval or error margin, which matches our earlier finding that none of fourteen platforms disclosed run-to-run variance.
Sources and further reading
- Vendor pricing page read at source 22 September 2026. Published tiers: $29 with 15 tracked prompts, $189 with 100, $489 with 400, and Enterprise custom from 1,000 prompts, with 15% off annually. Daily tracking frequency is stated across all tiers, which is the figure the whole calculation rests on. Add-ons published at $99 per 100 extra prompts and $9 to $439 a month per additional engine. The page publishes no variance figure, confidence interval or error margin. Named but not linked, per our policy on competitors.
- All error figures are our own arithmetic, not a vendor claim. Method: the approximate 95% margin of error for a proportion is one divided by the square root of the sample size, evaluated at the worst case of a 50% mention rate. Limitations stated in the text: it assumes independent samples and a stable underlying rate, and it is conservative at very high or very low mention rates.
- Pepper, AI search visibility tools ranked by sampling rate, 10 September 2026, for the earlier finding that none of fourteen platforms disclosed run-to-run variance.
- Google Search Central, guide to optimizing for generative AI features, page last updated 10 July 2026. Source of the reference to Search Console’s generative AI performance report and of the advice against providers who guarantee rankings. Applies to Google Search only.
- Microsoft, AI Performance in Bing Webmaster Tools, public preview announced 10 February 2026.
- Pepper, what actually matters in AI search measurement, for which metrics belong on the report in the first place.
- Pepper, Acceldata case study. One account, not a benchmark.
What is not here, and why. No vendor-supplied accuracy claims, because none is published. No variance figure of our own, because measuring it properly would require running a controlled study across engines and we have not done one. No tool ranking, which our existing comparison already covers. The error figures are a standard approximation rather than a precise interval, and the article says so twice. One vendor’s grid carries the whole calculation because it is the only one of four we re-checked this month that still publishes tracking frequency alongside prompt counts, which is itself a finding about the category.
Latest Blogs
Engines answer the same question differently each time, so every AI search tracking number is a sample with an error bar. Nobody in this category publishes that error bar. We worked it out from published tracking frequencies, and the result inverts the obvious assumption: moving up a tier buys you more prompts, not more confidence in any one of them. The number most teams act on weekly is the least reliable number the tool produces.
The short answer Fifteen tools, grouped by the three jobs people actually buy for, with every price re-read on 22 September 2026. Two things matter more than the rankings. First, this category rots fast: of the eight external tools on our own August list, two have withdrawn published pricing, one has changed its product line […]
Nobody has published a credible GEO timeline, and the ones being sold are borrowed from SEO. Here is what actually gates the clock, which parts move in days, and what to promise your board instead.
Get your hands on the latest news!

Similar Posts
18 generative engine optimization best practices that actually move citations
Artificial Intelligence
14 mins read
Top AI search engines in 2026: the complete overview
GEO / AI Search
10 mins read