The short answer
GEO is not equally worth doing everywhere. The gap between verticals is roughly twentyfold, and most articles on this subject average it away.
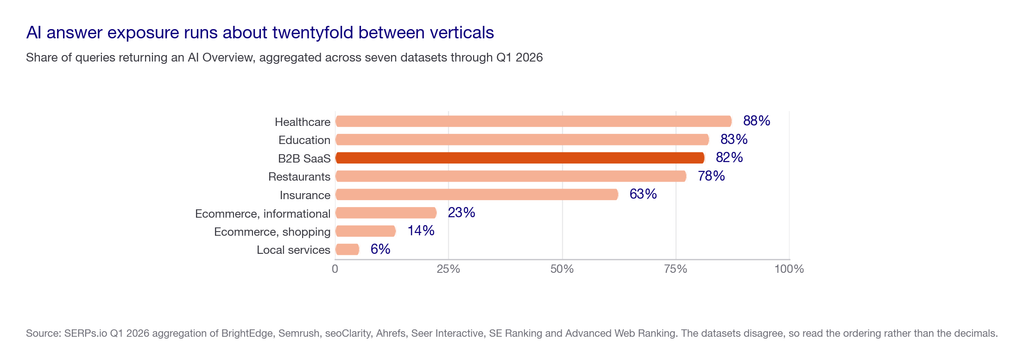
Aggregated Q1 2026 measurements put AI Overview prevalence at 88 percent in healthcare and 82 percent in B2B SaaS. At the other end sit ecommerce shopping queries at 14 percent, and local services at 4 to 8 percent.
So the honest answer to “should we do GEO” starts with “what do you sell, and to whom”.
Key takeaways
- B2B SaaS is among the most exposed verticals, at roughly 82 percent prevalence. A year earlier it sat near 36 percent, which is one of the steepest climbs measured anywhere.
- Ecommerce splits in two. Informational shopping research sits near 23 percent. Transactional shopping queries sit near 14 percent and have barely moved.
- Exposure is not the same as opportunity. A heavily exposed vertical can still be hard to win. A low-exposure one can be worth the work where a citation carries real money.
- The exact percentages disagree between datasets, and we say so. What is stable across all of them is the ordering.
- For SaaS specifically there is a cheap, unusual fix. 57 percent of B2B SaaS companies do not publish pricing, the highest non-disclosure rate of any vertical surveyed. Engines cannot cite an answer you never wrote down.
Where this comes from. We run organic for more than 250 enterprises at Pepper and track over 10 million prompts across every major engine. We work in several of the verticals below directly. That work shapes the view here, along with the client reviews we sit in every week and the conversations we have at the events we run.
What is SaaS SEO, and why does the vertical change the answer?
SaaS SEO is search work aimed at a buyer evaluating software. That happens over weeks, usually with a committee, and it starts long before anyone contacts a vendor.
Three features of that buying process decide how much GEO matters, and they vary sharply by industry.
- How researched the purchase is. Software buyers read comparisons, pricing pages and objection content for weeks. Somebody buying a phone case does not. Heavy research means more informational queries, which is where AI answers appear.
- How much the answer can be composed. An engine can confidently summarise what a platform does. It cannot tell you whether a specific pair of trainers is in stock in your size. That is why transactional retail queries behave differently.
- How much a citation is worth. Being named for a £30,000 annual contract beats being named for a £9 impulse purchase, even at identical click-through.
Those three together decide whether GEO pays in your vertical, rather than exposure alone. For the underlying discipline see what GEO is, and for how it relates to classic search, AEO vs SEO.
See where you show up. Pepper’s GEO platform tracks Brand Visibility, Domain Prompt Presence and Share of Voice across ChatGPT, Perplexity, Gemini, Claude and Google AI Overviews. Your team can log in, connect Search Console and GA4, manage the prompt set and run your own agents in the Agent Atlas. A growth team works the same account alongside you. Book a growth audit or see where you show up.
The exposure gap between verticals
Here is the spread, aggregated across seven measurement datasets through Q1 2026.
Read the top and the bottom together. A healthcare or SaaS brand sees an AI answer on most of its queries. A local services business sees one on roughly one query in twenty. Those are different problems, and one piece of advice cannot serve both.
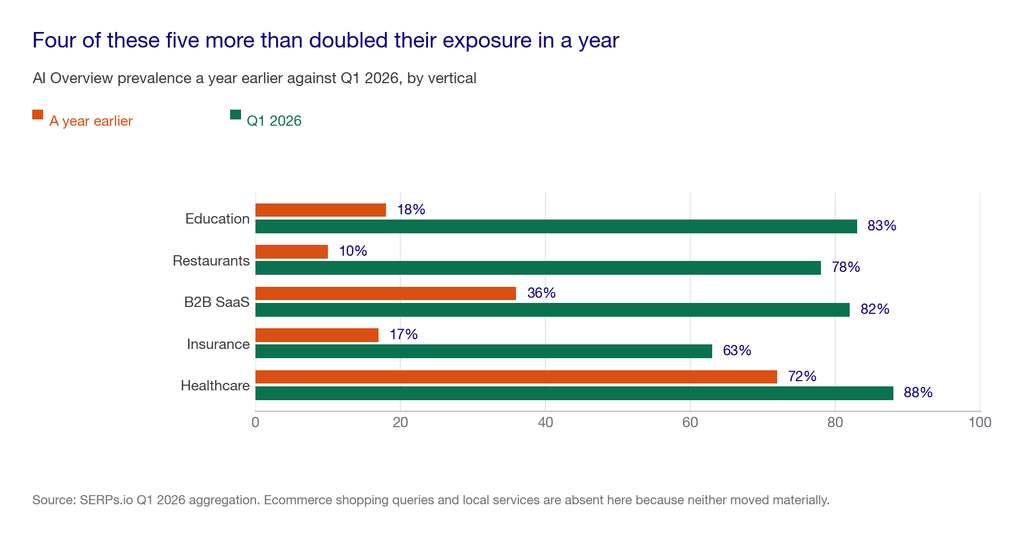
The growth rates matter as much as the levels. Several verticals moved very fast in twelve months. B2B SaaS went from about 36 percent to about 82 percent. Education went from about 18 percent to about 83 percent. Restaurants went from about 10 percent to about 78 percent.
Two verticals barely moved at all, and that is the more useful signal. Ecommerce shopping queries stayed near 14 percent. Local services stayed at 4 to 8 percent.
Where these numbers disagree, stated plainly
We are quoting an aggregation, not a single study, and it matters that you know how it was built.
The figures above pull together seven datasets: BrightEdge, Semrush, seoClarity, Ahrefs, Seer Interactive, SE Ranking and Advanced Web Ranking. Those datasets are built differently. Semrush uses a ten-million-keyword sample skewed to the long tail. seoClarity uses a 500-million-keyword US desktop dataset. BrightEdge curates tracked queries for large-client verticals, and Advanced Web Ranking tracks curated commercial keywords.
So the measurements disagree, because the datasets disagree. The aggregator’s own caution is worth repeating: treat every number as a trailing indicator rather than a commitment.
What survives that disagreement is the ordering. Every dataset puts healthcare, education and B2B SaaS near the top. Every one puts transactional retail and local services near the bottom. Plan against the ordering, and not against the decimal places.
Do GEO agencies work for ecommerce brands?
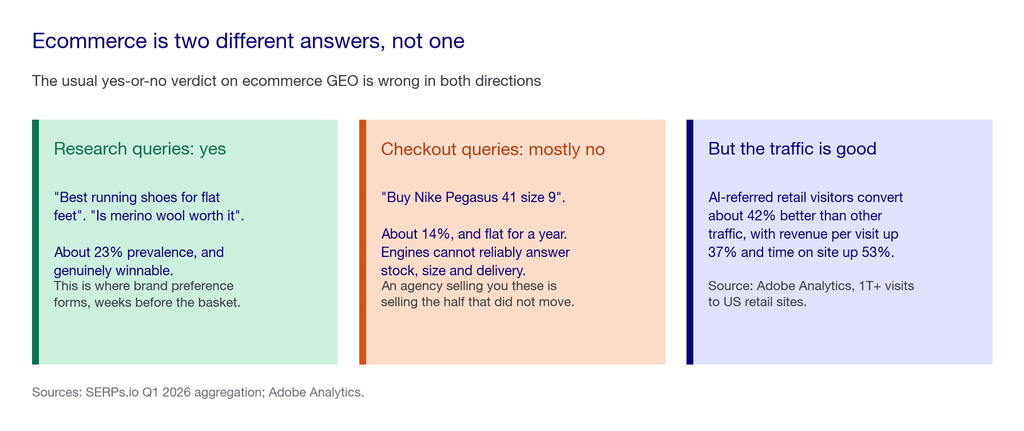
Partly, and the honest answer depends on which half of ecommerce you mean. This is the question we get asked most often by retail teams, and the usual yes-or-no answer is wrong in both directions.
- Informational shopping queries: yes. “Best running shoes for flat feet”. “Is merino wool worth it”. These sit near 23 percent prevalence and are genuinely winnable. They are also where brand preference forms, weeks before anyone opens a basket.
- Transactional shopping queries: mostly no. “Buy Nike Pegasus 41 size 9”. These sit near 14 percent and have stayed there. An engine cannot reliably answer stock, size and delivery, so it tends not to try at all.
- The traffic that does arrive is unusually good. Adobe Analytics measured more than a trillion visits to US retail sites. AI-referred visitors convert about 42 percent better, with revenue per visit up 37 percent and time on site up 53 percent.
Put those three together and the ecommerce answer becomes specific rather than vague. GEO for ecommerce is a research-phase investment, not a checkout-phase one. If an agency pitches you on capturing transactional queries through AI answers, they are selling you the 14 percent that has not moved in a year.

The platform side of this, including which tools track product-level visibility, is covered in GEO platforms for ecommerce.
Why B2B SaaS is the best-placed vertical right now
Three things stack up, and the third is the one nobody acts on.
First, exposure is near the top of the table at roughly 82 percent, having more than doubled in a year.
Second, the purchase is researched heavily. Committees read comparisons, pricing and objections for weeks before contact. That is exactly the query mix AI answers serve.
Third, and most usefully, the category has a self-inflicted gap. A survey of 169 marketers between November 2025 and February 2026, of whom 59 worked in B2B SaaS, found that 57 percent of B2B SaaS companies do not publish pricing. That was the highest non-disclosure rate of any vertical surveyed.
The same survey found 70 percent of brands with a mature AI search strategy publish pricing, against 43 percent of those with none.
Think about what that means mechanically. “How much does X cost” is one of the most common evaluation questions in software. If the answer exists nowhere on your site, no engine can cite you for it. It cites a review site, a competitor comparison, or a forum thread guessing at your price. You have handed the most commercially loaded question in your category to somebody else.
The same survey found 93 percent of B2B SaaS marketers call AI search visibility critically important, while only 14 percent have a mature documented strategy. That gap is the opportunity, and it will not stay open.
On this survey’s limits. It is 169 respondents overall and 59 in B2B SaaS, which is a small sample. Read it as a snapshot of what practitioners report rather than a population measurement. We use it alongside the prevalence data rather than instead of it.
Our vertical-specific breakdown is in GEO agencies for B2B SaaS, and the broader category view in AI search for SaaS.
Exposure is not the same as opportunity
This is where most vertical advice goes wrong. High exposure tells you an answer appears. It does not tell you whether winning it is worth the cost.
Four positions are worth separating, and only one of them is a clear yes.
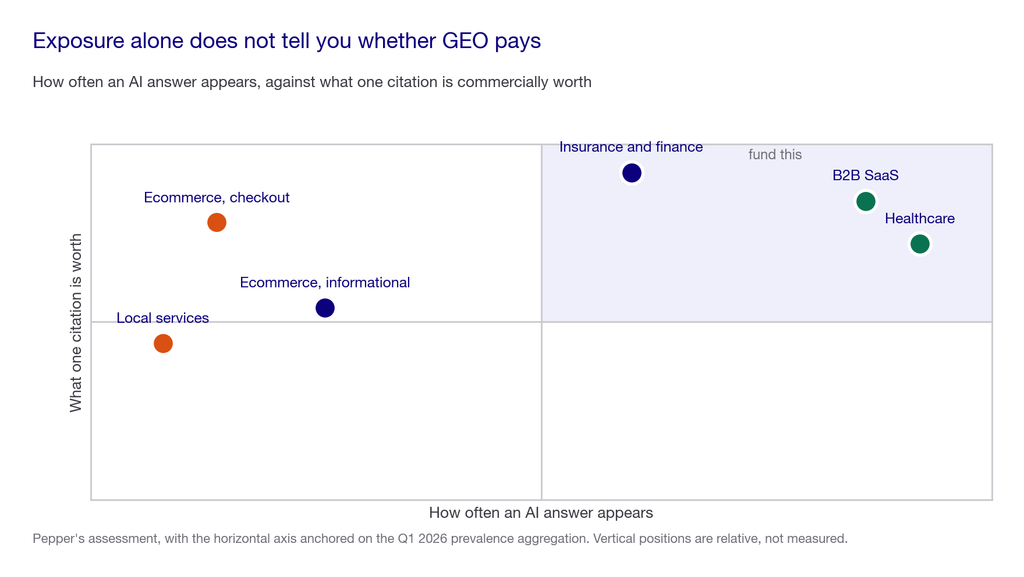
- High exposure, high value. B2B SaaS and healthcare. Fund this, and the vertical guides linked below go deeper.
- Mid exposure, very high value. Insurance and finance. Worth doing, and gated by compliance review rather than by demand.
- Low exposure, high value. Ecommerce checkout. The money is real and the answers rarely appear, so chase the research queries instead.
- Low exposure, moderate value. Local services. Spend on maps, reviews and proximity instead, and recheck in a year.
What this looked like on real accounts
Three verticals, three different shapes of result.
B2B SaaS. On a sales enablement account, AI Overview visibility went from 14 keywords to 97. Blog impressions rose from 200,000 to 417,000, and clicks rose 20 percent against an industry-wide decline. Their CMO described a direct connection between the investment and closed deals originating from LLMs.
Technical B2B. On a data observability account, organic traffic grew 6X and top-three keyword rankings went from 85 to more than 300. A single hero guide produced more than 260,000 impressions on its own.
Healthcare at enterprise scale. On an enterprise healthcare account, a two-year programme built on doctor-authored content produced 700 percent organic traffic growth and a 177 percent increase in revenue attributed to organic search.
Where this evidence is limited. These are our own published client results, selected because they worked. They are not a controlled study. They show the work pays in high-exposure verticals, and they do not prove it would pay in yours. That is what the test below is for.
Our methodology: how we weighted the verticals
| Input | Weight | What that means here |
|---|---|---|
| AI answer exposure | 30% | How often an answer appears at all, taken from the aggregated Q1 2026 ordering rather than any single figure |
| Research intensity of the purchase | 30% | How many informational queries sit between awareness and a decision |
| Commercial value of one citation | 25% | Contract size and margin. A citation on a £30,000 deal is not a citation on a £9 one |
| Competitive openness | 15% | Whether the questions are already well answered by incumbents, or left open |
Verticals at a glance
| Vertical | AI answer exposure | Research intensity | Value per citation | Typical monthly cost to compete | Where it falls short |
|---|---|---|---|---|---|
| B2B SaaS | ~82%, up from ~36% | Very high, committee-led | High, recurring contracts | Roughly $99 to $400 for tracking, plus content | Crowded with vendors doing the same thing, so depth decides it |
| Healthcare | ~88%, the highest measured | Very high, and safety-critical | High, but clinician time gates everything | Tracking plus clinician hours, the real constraint | Compliance slows publishing, and generic content is worthless here |
| Education | ~83%, up from ~18% | High, long consideration cycles | Moderate to high per enrolment | Tracking plus content | Seasonal demand makes short measurement windows misleading |
| Insurance and finance | ~55% to 63% | High, heavily regulated | Very high per policy or account | Tracking plus compliance review | Every claim needs sign-off, so cadence is slow |
| Ecommerce, informational | ~23% | Moderate, in the research phase | Moderate, but AI traffic converts ~42% better | Tracking plus content | Wins brand preference, not the checkout |
| Ecommerce, transactional | ~14%, essentially flat | Low at the point of purchase | High per order, rarely reachable | Hard to justify on this alone | Engines cannot answer stock, size and delivery reliably |
| Local services | 4% to 8% | Low, proximity-driven | Moderate per job | Rarely worth a GEO programme | Maps, reviews and proximity still decide this |
Exposure figures are aggregated Q1 2026 measurements across seven datasets, and they disagree with each other. Use the ordering rather than the decimals.
How to choose whether to fund GEO in your vertical
Do not take the table above as a verdict on your business. It is a starting prior, and the test below replaces it with your own numbers in an afternoon.
The scorecard
Score your own situation out of 100.
| Factor | Weight | How to score it honestly |
|---|---|---|
| Measured exposure on your own queries | 30% | You ran your top thirty queries and counted how many returned an AI answer, rather than trusting an industry average |
| Research intensity of your sale | 25% | Buyers read comparisons and objections for weeks before contact, rather than deciding in one session |
| Value of a single citation | 20% | Contract size justifies the work. A high-exposure vertical with tiny margins can still be a no |
| Openness of the questions | 15% | The answers currently cite forums, thin vendor pages or nothing, rather than three strong incumbents |
| Something to say that engines cannot compose | 10% | Pricing, real data, named expertise. Without one of these you have nothing to be cited for |
The live test, over 90 days
Write 30 prompts covering the questions your buyers actually ask, phrased the way they type them. Real questions, such as “how much does sales enablement software cost”, “best data observability platform for a small team”, “is merino wool worth the price” and “which CRM suits a ten-person agency”.
Run them across Google, ChatGPT and Perplexity. Record three things per prompt. Whether an AI answer appeared at all, whether you were named, and whether a page on your domain was cited.
Rerun the identical set monthly for 90 days. Three readings is the shortest honest window. One is a snapshot, two could be noise, three shows direction. Keep the set fixed, because changing it resets the comparison.
The first column settles this article’s question for your business. Count the answers and you have your own exposure rate rather than your industry’s average. The free method is in how to measure AI search visibility without expensive tools.
Weak approach versus strong approach
The weaker approach: read that your industry sits at 82 percent and approve a GEO programme. Then discover your own query mix is mostly transactional and barely triggers an answer.
The stronger approach: measure your own thirty queries first. Then fund the work if the exposure is really there, and say no if it is not.
Industry averages describe a category. Your query mix describes your business, and the two diverge more often than vertical benchmarks admit.
Red flags
- A pitch built on one industry statistic. The seven datasets behind these numbers disagree, so a single confident percentage is a sales aid rather than a measurement.
- Ecommerce GEO sold as checkout capture. Transactional shopping queries sit near 14 percent and have not moved in a year.
- The same programme offered to every vertical. Healthcare needs clinician authorship. SaaS needs published pricing. Local services usually need neither.
- No measurement of your own exposure. If nobody counted the answers on your queries, the plan rests on an average.
- Local services GEO at full price. At 4 to 8 percent exposure, maps, reviews and proximity still decide most of it.
- Guaranteed citations in any vertical. Nobody controls generated output, and Google warns against providers guaranteeing rankings.
Five questions worth asking
- “What is our measured exposure, not our industry’s?” If nobody ran the queries, everything after this is assumption.
- “Which half of our query mix is informational?” This decides the ecommerce answer, and several others.
- “What can we say that an engine cannot compose without us?” For most SaaS companies the honest answer starts with pricing.
- “Who is cited today on our most valuable question?” That tells you whether the seat is open.
- “In which vertical would you tell us not to bother?” A good partner names one. A weak one says every industry needs this.
Reduced to one principle: measure your own exposure before you accept your industry’s average.
One closing note that costs us something. If you sell locally, or your queries are overwhelmingly transactional, a GEO programme is a poor use of your budget and we would say so on a call. Every agency’s vertical advice tends to match the verticals it already serves, ours included.
What does this cost by vertical?
| What you are buying | Typical 2026 cost | What it covers |
|---|---|---|
| Measuring your own exposure | Free, an afternoon | Thirty queries run by hand, counting AI answers |
| Search Console and Bing Webmaster Tools | Free | First-party reporting on Google and Microsoft surfaces |
| Publishing pricing, for SaaS | Internal, roughly a day | The cheapest high-value fix available to most software companies |
| Content depth on your real questions | Front-loaded, then maintenance | Comparison, objection and operational pages |
| Clinician or specialist authorship | Specialist hours, the binding constraint | Healthcare, finance and other regulated verticals |
| Multi-engine tracking | Roughly $99 to $400 a month | Automated per-engine visibility and competitor share of voice |
| Platform plus a growth team | Custom | Pepper: tracking, plus the people and agents doing the work it points at |
The first row is free and it decides whether any of the rows below apply to you.
What nobody should promise you
That your industry average predicts your result. Query mix varies enormously inside every vertical.
A precise AI Overview prevalence figure for your sector. Seven datasets disagree, and the honest output is a range and an ordering.
That GEO captures transactional ecommerce demand. Those queries sit near 14 percent and have been flat for a year.
A guaranteed citation in any vertical. Nobody controls generated output, and Google warns against providers guaranteeing rankings.
When GEO is the wrong investment
The answer that costs us the sale. If you sell locally, or your buyers decide in a single session without research, you do not need a GEO programme and we would tell you not to buy one.
Local services sit at 4 to 8 percent exposure, and maps, reviews and proximity still decide most of that market. Spend the money there instead. Recheck in a year though. The fastest-moving vertical went from roughly 10 percent to roughly 78 percent in twelve months, so a low exposure rate today is not permanent.
Frequently asked questions
Do GEO agencies work for ecommerce brands?
Partly. Informational shopping queries sit near 23 percent prevalence and are winnable. Transactional shopping queries sit near 14 percent and have barely moved. Treat ecommerce GEO as a research-phase investment rather than a checkout-phase one.
Which industries have the highest AI Overview prevalence?
Aggregated Q1 2026 measurements put healthcare near 88 percent, education near 83 percent and B2B SaaS near 82 percent. Local services sit at 4 to 8 percent and transactional ecommerce near 14 percent. The spread across verticals is roughly twentyfold.
Is SaaS SEO still worth it in 2026?
Yes, and more than in most verticals. B2B SaaS exposure roughly doubled in a year to about 82 percent. Software purchases also involve weeks of comparison research, which is exactly the query type AI answers serve.
Why does publishing pricing matter for SaaS AI visibility?
Because engines cannot cite an answer you never published. One survey found 57 percent of B2B SaaS companies publish no pricing. The most commercially loaded question in the category then gets answered by review sites and competitors instead.
Does GEO work for local businesses?
Rarely enough to justify a programme. Local services show AI answers on roughly 4 to 8 percent of queries, and proximity, maps and reviews still decide most local buying decisions.
Why do AI Overview statistics vary so much between sources?
Because the underlying datasets differ. One vendor samples ten million long-tail keywords, another uses 500 million US desktop keywords, and others track curated commercial terms. The ordering between verticals stays consistent even when the percentages do not.
Does AI-referred traffic convert well in retail?
Yes, unusually well. Adobe Analytics measured over a trillion visits to US retail sites. AI-referred visitors converted about 42 percent better than other traffic, with revenue per visit up 37 percent.
How do I know if GEO is worth it for my business specifically?
Run your top thirty queries and count how many return an AI answer. That measured rate beats any industry benchmark. Query mix varies widely inside every vertical, and your own mix determines the return.
Where to go next
Take your thirty most valuable queries and run them. Count how many return an AI answer before you accept any number here as applying to you.
If your measured exposure is high, the vertical guides linked above go a level deeper. If it is low, that is a genuine answer and it saves you a budget line.
Learn AI Search · See our B2B SaaS work · Book a growth audit
Sources and further reading
- SERPs.io. AI Overview prevalence by industry, Q1 2026 benchmarks. An aggregation of seven datasets: BrightEdge, Semrush, seoClarity, Ahrefs, Seer Interactive, SE Ranking and Advanced Web Ranking. Source of the vertical ordering and the prevalence figures quoted. The authors state that measurements disagree because datasets disagree, and that every number should be treated as a trailing indicator rather than a commitment. Link
- CommonMind. “The 2026 State of AI Visibility in B2B SaaS”, published 19 April 2026. Survey of 169 marketers, marketing leaders and business owners across 11 or more industries, fielded November 2025 to February 2026, of whom 59 worked in B2B SaaS. Source of the pricing disclosure figures, the 93 percent importance against 14 percent maturity gap, and the mature-strategy pricing comparison. A small sample, and the authors describe it as a snapshot rather than a forecast. Link
- Adobe Analytics. Measurement across more than one trillion visits to US retail sites. Source of the 42 percent conversion difference, 37 percent revenue per visit and 53 percent time on site figures for AI-referred retail traffic.
- Google Search Central. AI search optimisation guidance, 15 May 2026. Confirms AI Overviews and AI Mode run on core Search ranking and quality systems with no separate AI index, and warns against providers guaranteeing rankings.
- Pepper case studies, figures as published: SalesHood, Acceldata and Apollo 24/7.
- Pepper vertical guides: B2B SaaS, healthcare, fintech, cybersecurity and developer tools.
- Deliberately excluded: any single authoritative per-industry prevalence figure presented as precise. No such figure exists, because the seven underlying datasets are built differently and disagree.
Latest Blogs
Most advice on this is inference dressed as fact. OpenAI documents exactly one thing clearly, which is access. Here is what is documented, what is inferred, and how to verify the rest for yourself.
Being named in an AI answer and having your page used as its source are different outcomes with different causes and different fixes. The gap between them is the most useful diagnostic in AI search, and most reporting collapses it into one number.
Every platform reports share of voice and almost none of them define it the same way. Here is the definition worth using, the three choices that change the number, and how to measure it yourself without buying anything.
Get your hands on the latest news!